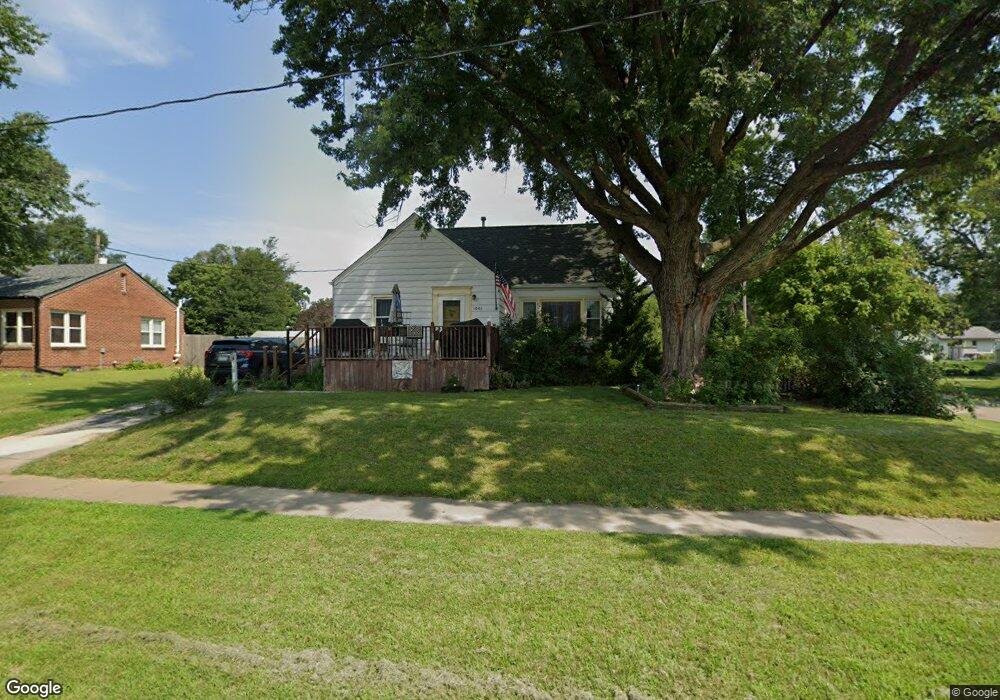
1001 Locust St West Des Moines, IA 50265
Estimated Value: $223,000 - $240,000
3
Beds
1
Bath
1,346
Sq Ft
$173/Sq Ft
Est. Value
About This Home
This home is located at 1001 Locust St, West Des Moines, IA 50265 and is currently estimated at $232,979, approximately $173 per square foot. 1001 Locust St is a home located in Polk County with nearby schools including Hillside Elementary School, Stilwell Junior High School, and Valley Southwoods Freshman High School.
Ownership History
Date
Name
Owned For
Owner Type
Purchase Details
Closed on
Apr 25, 2002
Sold by
Cross Thomas W
Bought by
Isenhoff William W and Isenhoff Eileen C
Current Estimated Value
Home Financials for this Owner
Home Financials are based on the most recent Mortgage that was taken out on this home.
Original Mortgage
$100,000
Outstanding Balance
$42,400
Interest Rate
7.13%
Estimated Equity
$190,579
Purchase Details
Closed on
Jun 4, 2001
Sold by
Cross Clifford W and Cross Phyllis
Bought by
Cross Clifford W
Create a Home Valuation Report for This Property
The Home Valuation Report is an in-depth analysis detailing your home's value as well as a comparison with similar homes in the area
Home Values in the Area
Average Home Value in this Area
Purchase History
| Date | Buyer | Sale Price | Title Company |
|---|---|---|---|
| Isenhoff William W | $99,500 | -- | |
| Cross Clifford W | -- | -- |
Source: Public Records
Mortgage History
| Date | Status | Borrower | Loan Amount |
|---|---|---|---|
| Open | Isenhoff William W | $100,000 |
Source: Public Records
Tax History Compared to Growth
Tax History
| Year | Tax Paid | Tax Assessment Tax Assessment Total Assessment is a certain percentage of the fair market value that is determined by local assessors to be the total taxable value of land and additions on the property. | Land | Improvement |
|---|---|---|---|---|
| 2025 | $3,052 | $216,300 | $43,700 | $172,600 |
| 2024 | $3,052 | $203,000 | $40,500 | $162,500 |
| 2023 | $2,856 | $203,000 | $40,500 | $162,500 |
| 2022 | $2,822 | $156,800 | $32,500 | $124,300 |
| 2021 | $2,678 | $156,800 | $32,500 | $124,300 |
| 2020 | $2,632 | $142,100 | $29,400 | $112,700 |
| 2019 | $2,456 | $142,100 | $29,400 | $112,700 |
| 2018 | $2,458 | $128,400 | $26,000 | $102,400 |
| 2017 | $2,390 | $128,400 | $26,000 | $102,400 |
| 2016 | $2,334 | $121,600 | $24,300 | $97,300 |
| 2015 | $2,334 | $121,600 | $24,300 | $97,300 |
| 2014 | $2,483 | $118,400 | $23,100 | $95,300 |
Source: Public Records
Map
Nearby Homes