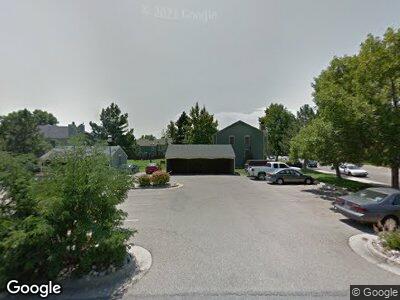
1001 Milo Cir Unit B Lafayette, CO 80026
Estimated Value: $325,643 - $373,000
2
Beds
1
Bath
840
Sq Ft
$422/Sq Ft
Est. Value
About This Home
This home is located at 1001 Milo Cir Unit B, Lafayette, CO 80026 and is currently estimated at $354,161, approximately $421 per square foot. 1001 Milo Cir Unit B is a home located in Boulder County with nearby schools including Ryan Elementary School, Angevine Middle School, and Centaurus High School.
Ownership History
Date
Name
Owned For
Owner Type
Purchase Details
Closed on
Jan 15, 1999
Sold by
Schlueter Sandra F and Anderson Stefani A
Bought by
Hunt Marsha J
Current Estimated Value
Home Financials for this Owner
Home Financials are based on the most recent Mortgage that was taken out on this home.
Original Mortgage
$75,900
Interest Rate
6.68%
Purchase Details
Closed on
Jul 31, 1996
Sold by
Katherine Grimsrud Kelga
Bought by
Schlueter Sandra F and Schlueter Stefani A
Home Financials for this Owner
Home Financials are based on the most recent Mortgage that was taken out on this home.
Original Mortgage
$50,000
Interest Rate
8.33%
Purchase Details
Closed on
Jun 30, 1995
Sold by
Sheridan Brian and Sheridan Mary Ellen
Bought by
Grimsrud Helga Katherine
Home Financials for this Owner
Home Financials are based on the most recent Mortgage that was taken out on this home.
Original Mortgage
$80,750
Interest Rate
7.65%
Purchase Details
Closed on
Mar 2, 1993
Bought by
Hunt Marsha J
Create a Home Valuation Report for This Property
The Home Valuation Report is an in-depth analysis detailing your home's value as well as a comparison with similar homes in the area
Home Values in the Area
Average Home Value in this Area
Purchase History
| Date | Buyer | Sale Price | Title Company |
|---|---|---|---|
| Hunt Marsha J | $101,900 | -- | |
| Schlueter Sandra F | $93,500 | -- | |
| Grimsrud Helga Katherine | $85,000 | -- | |
| Hunt Marsha J | $57,000 | -- |
Source: Public Records
Mortgage History
| Date | Status | Borrower | Loan Amount |
|---|---|---|---|
| Open | Hunt Marsha J | $105,550 | |
| Closed | Hunt Marsha J | $75,900 | |
| Previous Owner | Schlueter Sandra F | $50,000 | |
| Previous Owner | Grimsrud Helga Katherine | $80,750 |
Source: Public Records
Tax History Compared to Growth
Tax History
| Year | Tax Paid | Tax Assessment Tax Assessment Total Assessment is a certain percentage of the fair market value that is determined by local assessors to be the total taxable value of land and additions on the property. | Land | Improvement |
|---|---|---|---|---|
| 2024 | $1,527 | $20,519 | $5,575 | $14,944 |
| 2023 | $1,501 | $17,232 | $5,574 | $15,343 |
| 2022 | $1,607 | $17,104 | $4,351 | $12,753 |
| 2021 | $1,589 | $17,596 | $4,476 | $13,120 |
| 2020 | $1,574 | $17,224 | $3,718 | $13,506 |
| 2019 | $1,552 | $17,224 | $3,718 | $13,506 |
| 2018 | $1,346 | $14,746 | $3,600 | $11,146 |
| 2017 | $1,311 | $16,302 | $3,980 | $12,322 |
| 2016 | $1,094 | $11,917 | $2,866 | $9,051 |
| 2015 | $1,025 | $10,078 | $2,627 | $7,451 |
| 2014 | $910 | $10,078 | $2,627 | $7,451 |
Source: Public Records
Map
Nearby Homes
- 1035 Milo Cir Unit B
- 1055 Milo Cir Unit A
- 1032 Pegasus Place
- 960 Milo Cir Unit B
- 1198 Milo Cir Unit A
- 911 Homer Cir
- 717 S Carr Ave
- 880 Orion Dr
- 901 Delphi Dr
- 1250 Acropolis Dr
- 612 S Bermont Ave
- 910 Sparta Dr
- 1105 Bacchus Dr Unit 8
- 1100 Bacchus Dr Unit A
- 714 S Longmont Ave
- 1202 Warrior Way Unit A1202
- 1715 Pioneer Cir
- 718 Julian Cir
- 1902 Pioneer Cir
- 803 Old Wagon Trail Cir
- 1001 Milo Cir Unit A
- 1001 Milo Cir Unit B
- 1001 Milo Cir
- 1011 Milo Cir Unit A
- 1011 Milo Cir Unit B
- 1021 Milo Cir Unit A
- 1021 Milo Cir Unit B
- 1025 Milo Cir Unit A
- 1025 Milo Cir Unit B
- 1099 Milo Cir Unit A
- 1099 Milo Cir Unit B
- 1091 Milo Cir Unit A
- 1091 Milo Cir Unit B
- 1031 Milo Cir Unit A
- 1031 Milo Cir Unit B
- 1081 Milo Cir Unit A
- 1081 Milo Cir Unit B
- 1041 Milo Cir Unit A
- 1041 Milo Cir Unit B
- 1071 Milo Cir Unit B