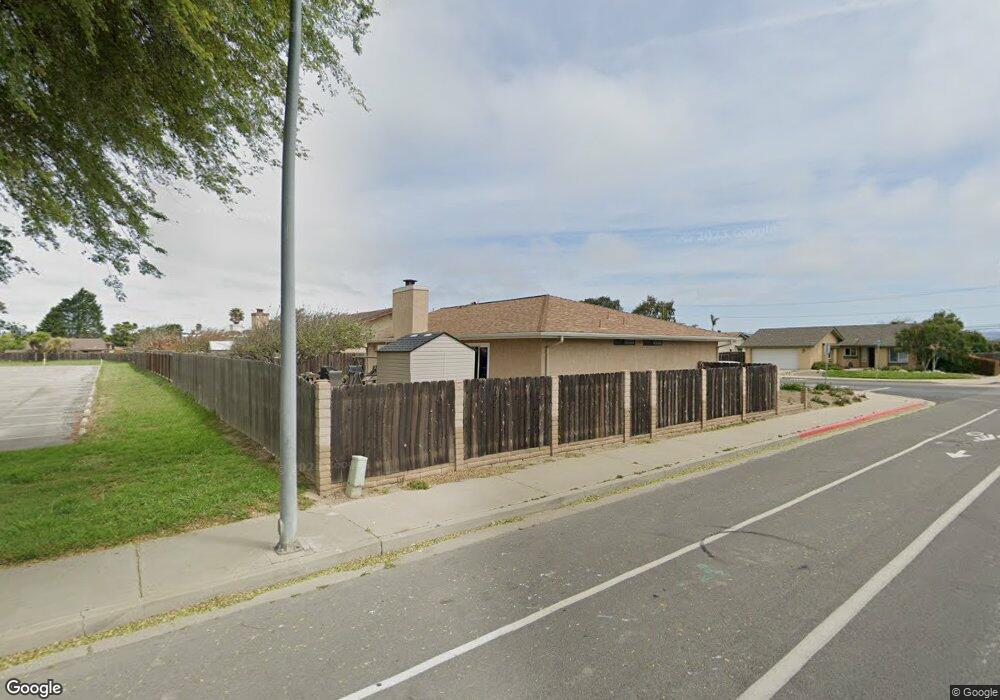
1001 N W St Lompoc, CA 93436
Estimated Value: $569,138 - $621,000
3
Beds
2
Baths
1,509
Sq Ft
$396/Sq Ft
Est. Value
About This Home
This home is located at 1001 N W St, Lompoc, CA 93436 and is currently estimated at $597,035, approximately $395 per square foot. 1001 N W St is a home located in Santa Barbara County with nearby schools including Clarence Ruth Elementary School, Lompoc Valley Middle School, and Lompoc High School.
Ownership History
Date
Name
Owned For
Owner Type
Purchase Details
Closed on
Feb 27, 2010
Sold by
Macteam Investments Inc
Bought by
Carpio Eric L and Carpio Elizabeth
Current Estimated Value
Home Financials for this Owner
Home Financials are based on the most recent Mortgage that was taken out on this home.
Original Mortgage
$252,345
Outstanding Balance
$171,536
Interest Rate
5.5%
Mortgage Type
FHA
Estimated Equity
$425,499
Purchase Details
Closed on
Jan 29, 2010
Sold by
Medina Elias L and Medina Maria Elena
Bought by
Macteam Investments Inc
Home Financials for this Owner
Home Financials are based on the most recent Mortgage that was taken out on this home.
Original Mortgage
$252,345
Outstanding Balance
$171,536
Interest Rate
5.5%
Mortgage Type
FHA
Estimated Equity
$425,499
Create a Home Valuation Report for This Property
The Home Valuation Report is an in-depth analysis detailing your home's value as well as a comparison with similar homes in the area
Home Values in the Area
Average Home Value in this Area
Purchase History
| Date | Buyer | Sale Price | Title Company |
|---|---|---|---|
| Carpio Eric L | $257,000 | Fidelity National Title Co | |
| Macteam Investments Inc | $176,640 | None Available |
Source: Public Records
Mortgage History
| Date | Status | Borrower | Loan Amount |
|---|---|---|---|
| Open | Carpio Eric L | $252,345 |
Source: Public Records
Tax History
| Year | Tax Paid | Tax Assessment Tax Assessment Total Assessment is a certain percentage of the fair market value that is determined by local assessors to be the total taxable value of land and additions on the property. | Land | Improvement |
|---|---|---|---|---|
| 2025 | $3,627 | $331,725 | $129,073 | $202,652 |
| 2023 | $3,627 | $318,846 | $124,062 | $194,784 |
| 2022 | $3,564 | $312,595 | $121,630 | $190,965 |
| 2021 | $3,604 | $306,467 | $119,246 | $187,221 |
| 2020 | $3,566 | $303,326 | $118,024 | $185,302 |
| 2019 | $3,507 | $297,379 | $115,710 | $181,669 |
| 2018 | $3,453 | $291,549 | $113,442 | $178,107 |
| 2017 | $3,390 | $285,833 | $111,218 | $174,615 |
| 2016 | $3,329 | $280,230 | $109,038 | $171,192 |
| 2014 | $3,259 | $270,616 | $105,298 | $165,318 |
Source: Public Records
Map
Nearby Homes
- 1103 Point Sal Loop
- 2205 Point Sal Loop
- 1012 W Anthony Way
- 1416 Glen Ellen Ln
- 2000 Green Ridge Cir
- 600 N Y St
- 1212 Timothy Ct
- 516 N U St
- 1344 Village Meadows Dr
- 420 N W St
- 933 Bellflower Ln
- 321 N Z St
- 321 W North Ave Unit 133
- 267 Village Circle Dr
- 230 N R St
- 1011 W Walnut Ave
- 1408 W Walnut Ave
- 526 N L St
- 112 N X St
- 1410 W Apricot Ave
Your Personal Tour Guide
Ask me questions while you tour the home.