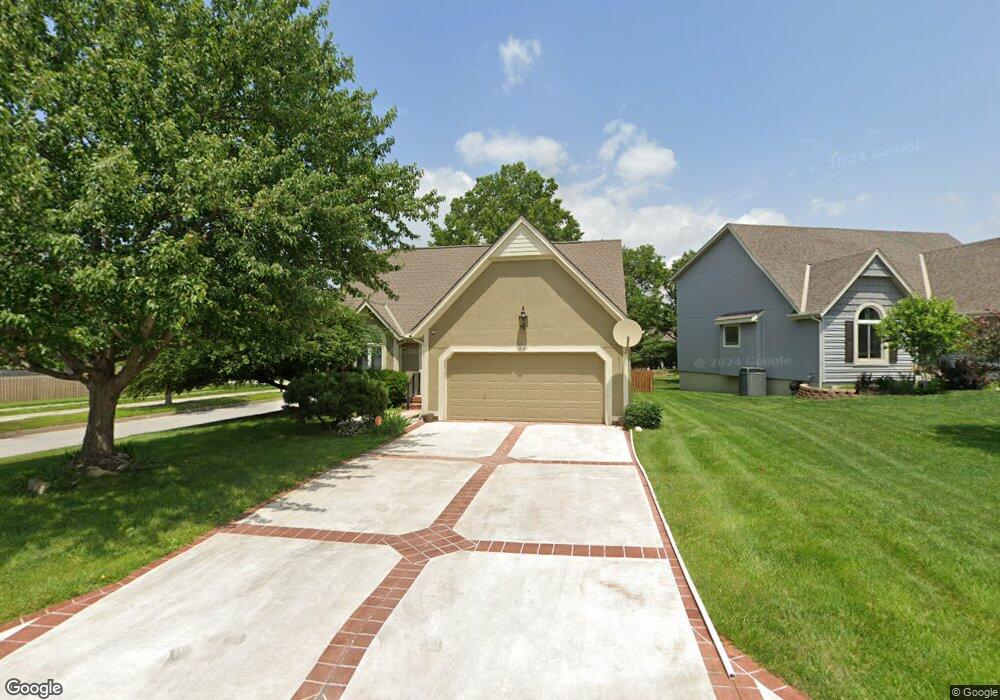
1001 NE Queens Cir Lees Summit, MO 64064
Estimated Value: $332,000 - $357,000
3
Beds
2
Baths
1,801
Sq Ft
$190/Sq Ft
Est. Value
About This Home
This home is located at 1001 NE Queens Cir, Lees Summit, MO 64064 and is currently estimated at $342,483, approximately $190 per square foot. 1001 NE Queens Cir is a home located in Jackson County with nearby schools including Voy Spears Jr. Elementary School, Delta Woods Middle School, and Blue Springs South High School.
Ownership History
Date
Name
Owned For
Owner Type
Purchase Details
Closed on
Feb 27, 2002
Sold by
Shelby Janet S
Bought by
Elkishawi Ali R and Elkishawi Hanan F
Current Estimated Value
Home Financials for this Owner
Home Financials are based on the most recent Mortgage that was taken out on this home.
Original Mortgage
$100,000
Interest Rate
6.29%
Mortgage Type
Purchase Money Mortgage
Purchase Details
Closed on
May 10, 2000
Sold by
Jakse Joseph J and Jakse Mary C
Bought by
Shelby Janet S
Home Financials for this Owner
Home Financials are based on the most recent Mortgage that was taken out on this home.
Original Mortgage
$109,200
Interest Rate
7.75%
Mortgage Type
Purchase Money Mortgage
Purchase Details
Closed on
Oct 23, 1996
Sold by
Rowe Kenneth W
Bought by
Jakse Joseph J and Jakse Mary C
Create a Home Valuation Report for This Property
The Home Valuation Report is an in-depth analysis detailing your home's value as well as a comparison with similar homes in the area
Home Values in the Area
Average Home Value in this Area
Purchase History
| Date | Buyer | Sale Price | Title Company |
|---|---|---|---|
| Elkishawi Ali R | -- | Stewart Title | |
| Shelby Janet S | -- | Stewart Title | |
| Jakse Joseph J | -- | Coffelt Land Title Inc |
Source: Public Records
Mortgage History
| Date | Status | Borrower | Loan Amount |
|---|---|---|---|
| Closed | Elkishawi Ali R | $100,000 | |
| Previous Owner | Shelby Janet S | $109,200 |
Source: Public Records
Tax History Compared to Growth
Tax History
| Year | Tax Paid | Tax Assessment Tax Assessment Total Assessment is a certain percentage of the fair market value that is determined by local assessors to be the total taxable value of land and additions on the property. | Land | Improvement |
|---|---|---|---|---|
| 2025 | $3,201 | $48,070 | $7,674 | $40,396 |
| 2024 | $3,144 | $41,800 | $3,800 | $38,000 |
| 2023 | $3,144 | $49,970 | $6,388 | $43,582 |
| 2022 | $3,211 | $37,810 | $4,066 | $33,744 |
| 2021 | $3,208 | $37,810 | $4,066 | $33,744 |
| 2020 | $3,083 | $35,932 | $4,066 | $31,866 |
| 2019 | $2,988 | $35,932 | $4,066 | $31,866 |
| 2018 | $2,978 | $34,742 | $5,740 | $29,002 |
| 2017 | $2,978 | $34,742 | $5,740 | $29,002 |
| 2016 | $2,581 | $30,210 | $4,864 | $25,346 |
| 2014 | $2,546 | $29,614 | $4,854 | $24,760 |
Source: Public Records
Map
Nearby Homes
- 917 NE Kenwood Dr
- 4517 NE Fairway Homes Dr
- 4524 NE Kingston Dr
- 4600 NE Kingston Dr
- 4605 NE Kingston Dr
- 1108 NE Goshen Ct
- 708 NE Lake Pointe Dr
- 4557 NE Webster Dr
- 1225 NE Kenwood Dr
- 4405 NE Blue Jay Dr
- 637 NE Shoreline Dr
- 4412 NE Gateway Dr
- 1317 NE Kenwood Dr
- 1305 NE Goshen Dr
- 712 NE Ashmont Place
- 4213 NE Kennesaw Ridge
- 801 NE Fairway Homes Ct
- 824 NE Algonquin St Unit A
- 4367 NE Hideaway Dr
- 4335 NE Hideaway Dr
- 1009 NE Queens Cir
- 1000 NE Queens Ct
- 1057 NE Queens Cir
- 1013 NE Queens Cir
- 1017 NE Queens Cir
- 1004 NE Queens Ct
- 1056 NE Queens Ct
- 1052 NE Queens Ct
- 1001C NE Whispering Winds Cir
- 1053 NE Queens Cir
- 1001B NE Whispering Winds Cir
- 1001D NE Whispering Winds Cir
- 1001A NE Whispering Winds Cir
- 1025 NE Queens Cir
- 1021 NE Queens Cir
- 1005A NE Whispering Winds Cir
- 1008 NE Queens Ct
- 1005B NE Whispering Winds Cir
- 1049 NE Queens Cir
- 1048 NE Queens Ct