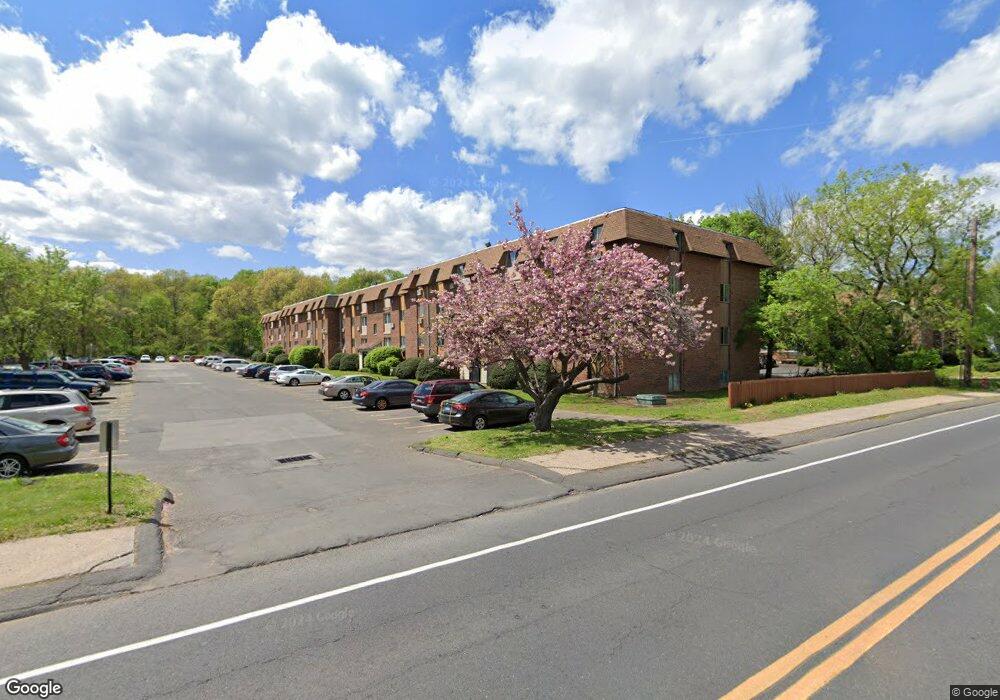
1001 Old Colony Rd Unit 7-9 Meriden, CT 06451
Estimated Value: $92,000 - $180,000
1
Bed
1
Bath
701
Sq Ft
$193/Sq Ft
Est. Value
About This Home
This home is located at 1001 Old Colony Rd Unit 7-9, Meriden, CT 06451 and is currently estimated at $134,995, approximately $192 per square foot. 1001 Old Colony Rd Unit 7-9 is a home located in New Haven County with nearby schools including Israel Putnam School, Lincoln Middle School, and Orville H. Platt High School.
Ownership History
Date
Name
Owned For
Owner Type
Purchase Details
Closed on
May 19, 2003
Sold by
Deptula Margaret
Bought by
Mallinson Adriana
Current Estimated Value
Home Financials for this Owner
Home Financials are based on the most recent Mortgage that was taken out on this home.
Original Mortgage
$40,700
Outstanding Balance
$17,600
Interest Rate
5.84%
Estimated Equity
$117,395
Purchase Details
Closed on
Jul 5, 2001
Sold by
White Rylin L
Bought by
Deptula Margaret
Home Financials for this Owner
Home Financials are based on the most recent Mortgage that was taken out on this home.
Original Mortgage
$33,900
Interest Rate
7.21%
Purchase Details
Closed on
Jan 30, 1998
Sold by
Foley Barbara A
Bought by
Perry Rylin T
Purchase Details
Closed on
May 1, 1996
Sold by
Sowamco Xiv Ltd
Bought by
Foley Barbara A
Create a Home Valuation Report for This Property
The Home Valuation Report is an in-depth analysis detailing your home's value as well as a comparison with similar homes in the area
Home Values in the Area
Average Home Value in this Area
Purchase History
| Date | Buyer | Sale Price | Title Company |
|---|---|---|---|
| Mallinson Adriana | $42,000 | -- | |
| Deptula Margaret | $35,000 | -- | |
| Perry Rylin T | $29,900 | -- | |
| Foley Barbara A | $27,000 | -- |
Source: Public Records
Mortgage History
| Date | Status | Borrower | Loan Amount |
|---|---|---|---|
| Closed | Foley Barbara A | $16,420 | |
| Closed | Foley Barbara A | $20,000 | |
| Open | Foley Barbara A | $40,700 | |
| Previous Owner | Foley Barbara A | $33,900 |
Source: Public Records
Tax History Compared to Growth
Tax History
| Year | Tax Paid | Tax Assessment Tax Assessment Total Assessment is a certain percentage of the fair market value that is determined by local assessors to be the total taxable value of land and additions on the property. | Land | Improvement |
|---|---|---|---|---|
| 2025 | $1,628 | $40,600 | $0 | $40,600 |
| 2024 | $1,474 | $40,600 | $0 | $40,600 |
| 2023 | $1,412 | $40,600 | $0 | $40,600 |
| 2022 | $1,339 | $40,600 | $0 | $40,600 |
| 2021 | $1,284 | $31,430 | $0 | $31,430 |
| 2020 | $1,284 | $31,430 | $0 | $31,430 |
| 2019 | $1,284 | $31,430 | $0 | $31,430 |
| 2018 | $1,290 | $31,430 | $0 | $31,430 |
| 2017 | $1,255 | $31,430 | $0 | $31,430 |
| 2016 | $1,685 | $45,990 | $0 | $45,990 |
| 2015 | $1,685 | $45,990 | $0 | $45,990 |
| 2014 | -- | $45,990 | $0 | $45,990 |
Source: Public Records
Map
Nearby Homes
- 1001 Old Colony Rd Unit 2-4
- 1012 Old Colony Rd Unit LOT 81
- 1012 Old Colony Rd Unit 85
- 1367 Hanover Ave Unit 703
- 36 Raymond Dr
- 25 Raymond Dr
- 550 New Hanover Ave
- 439 New Hanover Ave
- 1130 Hanover Ave
- 34 Hillside St
- 293 New Hanover Ave
- 9 Staffordshire Commons Dr
- 177 Parkview St
- 165 Parkview St
- 219 S Broad St Unit S105
- 219 S Broad St Unit N217
- 24 Cutlery Ave
- 255 Old Stagecoach Rd
- 66 Evansville Ave
- 58 Baldwin St
- 1001 Old Colony Rd Unit 7-22
- 1001 Old Colony Rd Unit 7-21
- 1001 Old Colony Rd Unit 7-20
- 1001 Old Colony Rd Unit 7-19
- 1001 Old Colony Rd Unit 7-18
- 1001 Old Colony Rd Unit 7-17
- 1001 Old Colony Rd Unit 7-16
- 1001 Old Colony Rd Unit 7-15
- 1001 Old Colony Rd Unit 7-14
- 1001 Old Colony Rd Unit 7-13
- 1001 Old Colony Rd Unit 7-12
- 1001 Old Colony Rd Unit 7-11
- 1001 Old Colony Rd Unit 7-10
- 1001 Old Colony Rd Unit 7-8
- 1001 Old Colony Rd Unit 7-7
- 1001 Old Colony Rd Unit 7-6
- 1001 Old Colony Rd Unit 7-5
- 1001 Old Colony Rd Unit 7-4
- 1001 Old Colony Rd Unit 7-3
- 1001 Old Colony Rd Unit 7-2