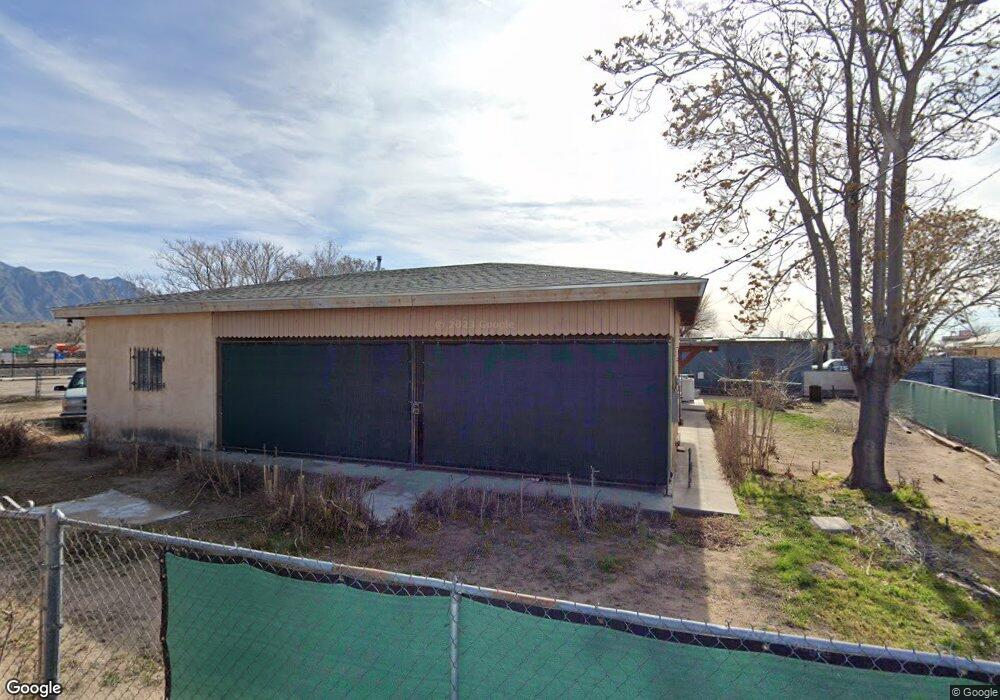
1001 Railroad Track Rd Bernalillo, NM 87004
Estimated Value: $231,000 - $339,000
2
Beds
1
Bath
1,331
Sq Ft
$214/Sq Ft
Est. Value
About This Home
This home is located at 1001 Railroad Track Rd, Bernalillo, NM 87004 and is currently estimated at $285,000, approximately $214 per square foot. 1001 Railroad Track Rd is a home located in Sandoval County with nearby schools including Bernalillo High School and Sandoval Academy of Bilingual Education.
Ownership History
Date
Name
Owned For
Owner Type
Purchase Details
Closed on
Jun 28, 2024
Sold by
Pulte Homes Of New Mexico Inc
Bought by
Niba George S
Current Estimated Value
Purchase Details
Closed on
May 31, 2024
Sold by
Pulte Homes Of New Mexico Inc
Bought by
Chavez Jeffrey A and Gonzales Destiny
Purchase Details
Closed on
Apr 26, 2024
Sold by
Pulte Homes Of New Mexico Inc
Bought by
Galaviz Isaac G and Newell Vanessa Nd
Purchase Details
Closed on
Apr 19, 2024
Sold by
Pulte Homes Of New Mexico Inc
Bought by
Cdebaca-Grogan Dakota Chee and Cdebaca Rosalind Lee
Purchase Details
Closed on
Jan 29, 2024
Sold by
Pulte Homes Of New Maxico Inc
Bought by
Halvorsen Sinead
Purchase Details
Closed on
Apr 19, 2023
Sold by
Pulte Homes Of New Mexico Inc
Bought by
Maclachlan Barbara G
Purchase Details
Closed on
Jan 7, 2009
Sold by
Ortiz Juan B
Bought by
Martinez Mary Louise and Martinez Mary Jane
Create a Home Valuation Report for This Property
The Home Valuation Report is an in-depth analysis detailing your home's value as well as a comparison with similar homes in the area
Home Values in the Area
Average Home Value in this Area
Purchase History
| Date | Buyer | Sale Price | Title Company |
|---|---|---|---|
| Niba George S | -- | Pgp Title | |
| Chavez Jeffrey A | -- | Pgp Title | |
| Galaviz Isaac G | -- | Pgp Title | |
| Cdebaca-Grogan Dakota Chee | -- | Pgp Title | |
| Halvorsen Sinead | -- | Pgp Title | |
| Halvorsen Sinead | -- | Pgp Title | |
| Maclachlan Barbara G | -- | Pgp Title | |
| Martinez Mary Louise | -- | Stewart Title |
Source: Public Records
Tax History Compared to Growth
Tax History
| Year | Tax Paid | Tax Assessment Tax Assessment Total Assessment is a certain percentage of the fair market value that is determined by local assessors to be the total taxable value of land and additions on the property. | Land | Improvement |
|---|---|---|---|---|
| 2025 | $1,071 | $37,270 | $3,621 | $33,649 |
| 2024 | $1,079 | $36,184 | $3,552 | $32,632 |
| 2023 | $1,079 | $35,130 | $3,484 | $31,646 |
| 2022 | $1,046 | $34,107 | $3,415 | $30,692 |
| 2021 | $1,029 | $33,114 | $3,415 | $29,699 |
| 2020 | $997 | $32,150 | $0 | $0 |
| 2019 | $972 | $31,213 | $0 | $0 |
| 2018 | $880 | $30,304 | $0 | $0 |
| 2017 | $851 | $29,422 | $0 | $0 |
| 2016 | $966 | $29,422 | $0 | $0 |
| 2014 | $942 | $29,422 | $0 | $0 |
| 2013 | -- | $28,609 | $8,769 | $19,840 |
Source: Public Records
Map
Nearby Homes
- 912 Camino Del Pueblo
- 926 Oak St Unit A-2
- 1100 Calle Madera
- 1201 Calle Placitas
- 1174 Calle San Lorenzo
- 1242 Calle Madera
- 1134 Maple St
- 624 Santo Domingo
- 307 Calle Barrio Nuevo
- 542 Coronado Dr
- 530 Coronado Dr
- 428 S Camino Del Pueblo
- 501 Calle de La Angel
- 127 S Camino Del Pueblo
- 903 Camino Vista Rio
- 959 Salt Cedar Ct
- 978 Prairie Zinnia Dr
- 927 Camino Vista Rio
- 901 Golden Yarrow Trail
- 1024 Evening Primrose
- 1007 Railroad Track Rd
- 124 Calle Don Pedro
- 939 Railroad Track Rd
- 1018 S Camino Del Pueblo
- 2029 Railroad Track Rd
- 112 E Bernalillo
- 117 E Avenida Bernalillo
- 961 S Camino Del Pueblo
- 993 Camino Del Pueblo
- 987 Camino Del Pueblo
- 988 Oak St
- 1019 S Camino Del Pueblo
- 208 E Avenida Bernalillo
- 111 E Avenida Bernalillo
- 161 E Avenida Bernalillo
- 119 E Avenida Bernalillo
- 1013 S Camino Del Pueblo
- 995 S Camino Del Pueblo
- 1007 S Camino Del Pueblo
- 216 E Avenida Bernalillo