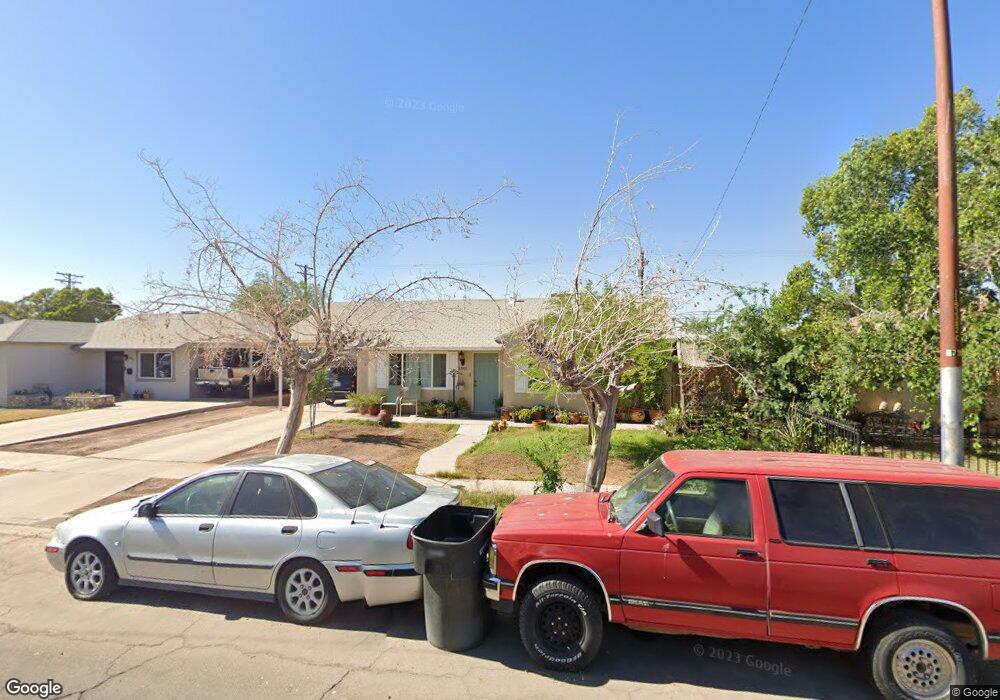
1001 Rose Ave El Centro, CA 92243
Estimated Value: $262,000 - $299,000
3
Beds
--
Bath
967
Sq Ft
$282/Sq Ft
Est. Value
About This Home
This home is located at 1001 Rose Ave, El Centro, CA 92243 and is currently estimated at $272,466, approximately $281 per square foot. 1001 Rose Ave is a home located in Imperial County with nearby schools including McKinley Elementary School, Kennedy Middle School, and Southwest High School.
Ownership History
Date
Name
Owned For
Owner Type
Purchase Details
Closed on
Oct 20, 2011
Sold by
Duggins Jim and Duggins Kathy
Bought by
Lopez Eduardo Lopez and Lopez Hilda I
Current Estimated Value
Home Financials for this Owner
Home Financials are based on the most recent Mortgage that was taken out on this home.
Original Mortgage
$87,718
Outstanding Balance
$60,258
Interest Rate
4.25%
Mortgage Type
FHA
Estimated Equity
$212,208
Purchase Details
Closed on
Apr 12, 2011
Sold by
Pascua Darrol J and Pascua Aurora
Bought by
Duggins Jim and Duggins Kathy
Purchase Details
Closed on
Oct 10, 2000
Sold by
Emc Mtg Company
Bought by
Pascua Darroll J and Pascua Aurora
Home Financials for this Owner
Home Financials are based on the most recent Mortgage that was taken out on this home.
Original Mortgage
$83,871
Interest Rate
7.82%
Mortgage Type
FHA
Purchase Details
Closed on
Apr 6, 2000
Sold by
Lamphere Michael James and Lamphere Mary Frances
Bought by
Emc Mtg Company
Create a Home Valuation Report for This Property
The Home Valuation Report is an in-depth analysis detailing your home's value as well as a comparison with similar homes in the area
Home Values in the Area
Average Home Value in this Area
Purchase History
| Date | Buyer | Sale Price | Title Company |
|---|---|---|---|
| Lopez Eduardo Lopez | $90,000 | Chicago Title Company | |
| Duggins Jim | $46,801 | None Available | |
| Pascua Darroll J | $84,000 | Fidelity National Title Co | |
| Emc Mtg Company | $61,589 | First American Title Ins Co |
Source: Public Records
Mortgage History
| Date | Status | Borrower | Loan Amount |
|---|---|---|---|
| Open | Lopez Eduardo Lopez | $87,718 | |
| Previous Owner | Pascua Darroll J | $83,871 |
Source: Public Records
Tax History Compared to Growth
Tax History
| Year | Tax Paid | Tax Assessment Tax Assessment Total Assessment is a certain percentage of the fair market value that is determined by local assessors to be the total taxable value of land and additions on the property. | Land | Improvement |
|---|---|---|---|---|
| 2025 | $1,189 | $113,032 | $25,114 | $87,918 |
| 2023 | $1,189 | $108,645 | $24,140 | $84,505 |
| 2022 | $1,132 | $106,516 | $23,667 | $82,849 |
| 2021 | $1,102 | $104,428 | $23,203 | $81,225 |
| 2020 | $1,122 | $103,359 | $22,966 | $80,393 |
| 2019 | $1,087 | $101,333 | $22,516 | $78,817 |
| 2018 | $1,080 | $99,347 | $22,075 | $77,272 |
| 2017 | $1,067 | $97,400 | $21,643 | $75,757 |
| 2016 | $1,044 | $95,491 | $21,219 | $74,272 |
| 2015 | $1,028 | $94,058 | $20,901 | $73,157 |
| 2014 | $806 | $75,000 | $20,000 | $55,000 |
Source: Public Records
Map
Nearby Homes
- 1027 Rose Ave
- 1034 Woodward Ave
- 796 Stacey Ave
- 874 W Pico Ave
- 1066 W Pico Ave
- 1444 Highway 86
- 1751 N 8th St
- 1751 N McDonald St
- 1751 N McDonald St Unit 153
- 583 El Centro Ave
- 436 W Euclid Ave
- 1630 Adams Ave Unit 2
- 1653 W Barbara Worth Dr Unit 1653
- 2208 N La Brucherie Rd Unit 2204
- 1850 Lincoln Ave Unit 142
- 1850 Lincoln Ave Unit 120
- 1850 Lincoln Ave Unit 91
- 314 Magnolia Ave
- 310 Magnolia Ave
- 1850 W Lincoln Ave Unit 57