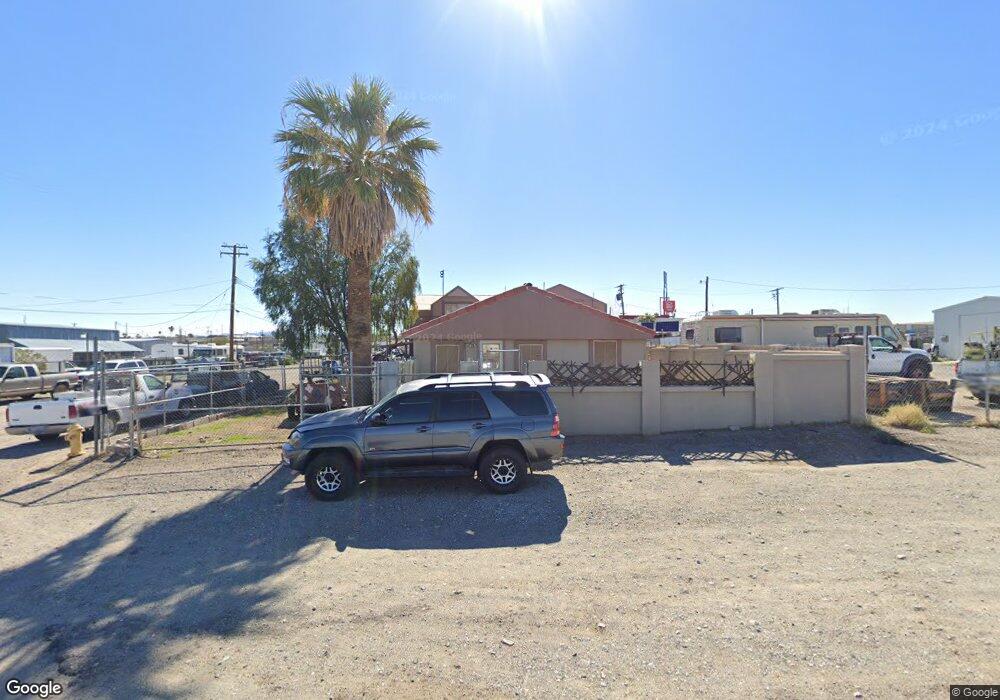
1001 Vine St Needles, CA 92363
Estimated Value: $114,000 - $239,969
Studio
--
Bath
--
Sq Ft
6,360
Sq Ft Lot
About This Home
This home is located at 1001 Vine St, Needles, CA 92363 and is currently estimated at $161,990. 1001 Vine St is a home located in San Bernardino County with nearby schools including Vista Colorado Elementary School, Chemehuevi Valley Elementary School, and Needles Middle School.
Ownership History
Date
Name
Owned For
Owner Type
Purchase Details
Closed on
Mar 21, 2005
Sold by
Cross James L
Bought by
Cross James L and Cross Cathy K
Current Estimated Value
Purchase Details
Closed on
Jul 27, 1998
Sold by
Cross James L
Bought by
Cross James L and Cross Cathy K
Home Financials for this Owner
Home Financials are based on the most recent Mortgage that was taken out on this home.
Original Mortgage
$60,000
Interest Rate
6.79%
Purchase Details
Closed on
Jun 16, 1997
Sold by
Cross Janet K
Bought by
Cross James L
Create a Home Valuation Report for This Property
The Home Valuation Report is an in-depth analysis detailing your home's value as well as a comparison with similar homes in the area
Home Values in the Area
Average Home Value in this Area
Purchase History
| Date | Buyer | Sale Price | Title Company |
|---|---|---|---|
| Cross James L | -- | First American | |
| Cross James L | -- | -- | |
| Cross James L | -- | -- |
Source: Public Records
Mortgage History
| Date | Status | Borrower | Loan Amount |
|---|---|---|---|
| Previous Owner | Cross James L | $60,000 |
Source: Public Records
Tax History
| Year | Tax Paid | Tax Assessment Tax Assessment Total Assessment is a certain percentage of the fair market value that is determined by local assessors to be the total taxable value of land and additions on the property. | Land | Improvement |
|---|---|---|---|---|
| 2025 | $785 | $55,757 | $20,908 | $34,849 |
| 2024 | $771 | $54,664 | $20,498 | $34,166 |
| 2023 | $850 | $53,592 | $20,096 | $33,496 |
| 2022 | $831 | $52,541 | $19,702 | $32,839 |
| 2021 | $818 | $51,511 | $19,316 | $32,195 |
| 2020 | $812 | $50,983 | $19,118 | $31,865 |
| 2019 | $816 | $49,983 | $18,743 | $31,240 |
| 2018 | $814 | $49,002 | $18,375 | $30,627 |
| 2017 | $792 | $48,041 | $18,015 | $30,026 |
| 2016 | $720 | $47,099 | $17,662 | $29,437 |
| 2015 | $610 | $46,392 | $17,397 | $28,995 |
| 2014 | $551 | $45,483 | $17,056 | $28,427 |
Source: Public Records
Map
Nearby Homes
Your Personal Tour Guide
Ask me questions while you tour the home.