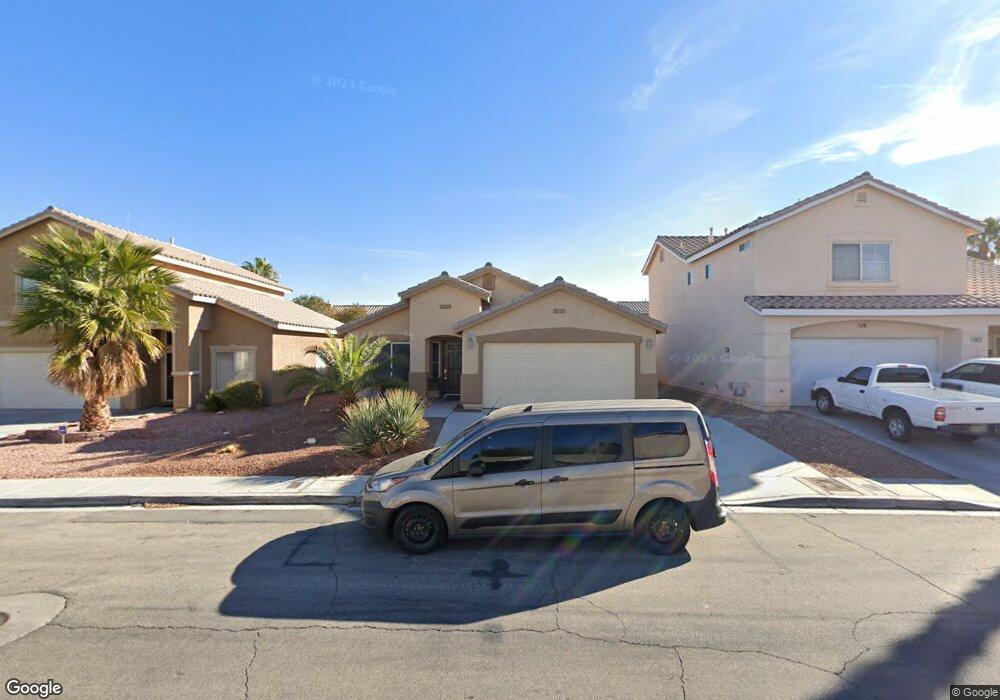
10010 Clear Crystal St Las Vegas, NV 89183
Silverado Ranch NeighborhoodEstimated Value: $386,263 - $428,000
3
Beds
2
Baths
1,410
Sq Ft
$291/Sq Ft
Est. Value
About This Home
This home is located at 10010 Clear Crystal St, Las Vegas, NV 89183 and is currently estimated at $410,566, approximately $291 per square foot. 10010 Clear Crystal St is a home located in Clark County with nearby schools including John R. Hummel Elementary School, Charles Silvestri Junior High School, and Liberty High School.
Ownership History
Date
Name
Owned For
Owner Type
Purchase Details
Closed on
Dec 11, 2020
Sold by
Searles Michael Douglas
Bought by
Michael Douglas Searles Revocable Trust and Searles
Current Estimated Value
Purchase Details
Closed on
Nov 11, 2009
Sold by
Searles Michael D
Bought by
Searles Michael D
Home Financials for this Owner
Home Financials are based on the most recent Mortgage that was taken out on this home.
Original Mortgage
$126,700
Interest Rate
4.92%
Mortgage Type
New Conventional
Purchase Details
Closed on
Nov 4, 1999
Sold by
Emerald Ridge Llc
Bought by
Searles Michael D
Home Financials for this Owner
Home Financials are based on the most recent Mortgage that was taken out on this home.
Original Mortgage
$126,750
Interest Rate
7.83%
Create a Home Valuation Report for This Property
The Home Valuation Report is an in-depth analysis detailing your home's value as well as a comparison with similar homes in the area
Home Values in the Area
Average Home Value in this Area
Purchase History
| Date | Buyer | Sale Price | Title Company |
|---|---|---|---|
| Michael Douglas Searles Revocable Trust | -- | None Listed On Document | |
| Searles Michael D | -- | North American Title Main | |
| Searles Michael D | $133,436 | United Title |
Source: Public Records
Mortgage History
| Date | Status | Borrower | Loan Amount |
|---|---|---|---|
| Previous Owner | Searles Michael D | $126,700 | |
| Previous Owner | Searles Michael D | $126,750 |
Source: Public Records
Tax History Compared to Growth
Tax History
| Year | Tax Paid | Tax Assessment Tax Assessment Total Assessment is a certain percentage of the fair market value that is determined by local assessors to be the total taxable value of land and additions on the property. | Land | Improvement |
|---|---|---|---|---|
| 2025 | $2,048 | $99,024 | $40,600 | $58,424 |
| 2024 | $1,897 | $99,024 | $40,600 | $58,424 |
| 2023 | $1,897 | $87,262 | $31,850 | $55,412 |
| 2022 | $1,757 | $76,464 | $25,900 | $50,564 |
| 2021 | $1,627 | $72,665 | $24,500 | $48,165 |
| 2020 | $1,508 | $72,343 | $24,500 | $47,843 |
| 2019 | $1,413 | $67,800 | $20,650 | $47,150 |
| 2018 | $1,348 | $62,851 | $17,500 | $45,351 |
| 2017 | $1,809 | $61,694 | $15,750 | $45,944 |
| 2016 | $1,263 | $58,048 | $11,900 | $46,148 |
| 2015 | $1,260 | $43,511 | $9,800 | $33,711 |
| 2014 | $1,223 | $40,454 | $7,000 | $33,454 |
Source: Public Records
Map
Nearby Homes
- 10025 Catseye Cove Ct
- 829 Dancing Vines Ave
- 10133 Rice Paper St
- 10142 Rice Paper St
- 638 Ribbon Grass Ave
- 10013 Solid Lime St
- 710 Elliot Peak Ave
- 9854 Canterbury Creek St
- 10208 Ghost Gum St
- 925 Scarlet Haze Ave Unit 2
- 9792 Cordova Vista Ct
- 506 Green Gables Ave
- 9940 Trailing Vine St
- 9801 Bradford Summit St
- 754 Canfield Point Ave
- 10164 Tree Bark St
- 10265 Moth Orchid Ct
- 911 Plantain Lily Ave
- 694 Baldurn Ave
- 10266 Martinsburg Ct
- 10000 Clear Crystal St
- 10020 Clear Crystal St
- 9990 Clear Crystal St
- 10030 Clear Crystal St
- 10011 Oyster Pearl St
- 10021 Oyster Pearl St
- 10001 Oyster Pearl St
- 722 Peach Coral St
- 10031 Oyster Pearl St
- 9980 Clear Crystal St
- 10040 Clear Crystal St
- 9991 Oyster Pearl St
- 9999 Clear Crystal St Unit na
- 9999 Clear Crystal St
- 9981 Oyster Pearl St
- 10041 Oyster Pearl St
- 9989 Clear Crystal St
- 9970 Clear Crystal St
- 10050 Clear Crystal St
- 718 Peach Coral St