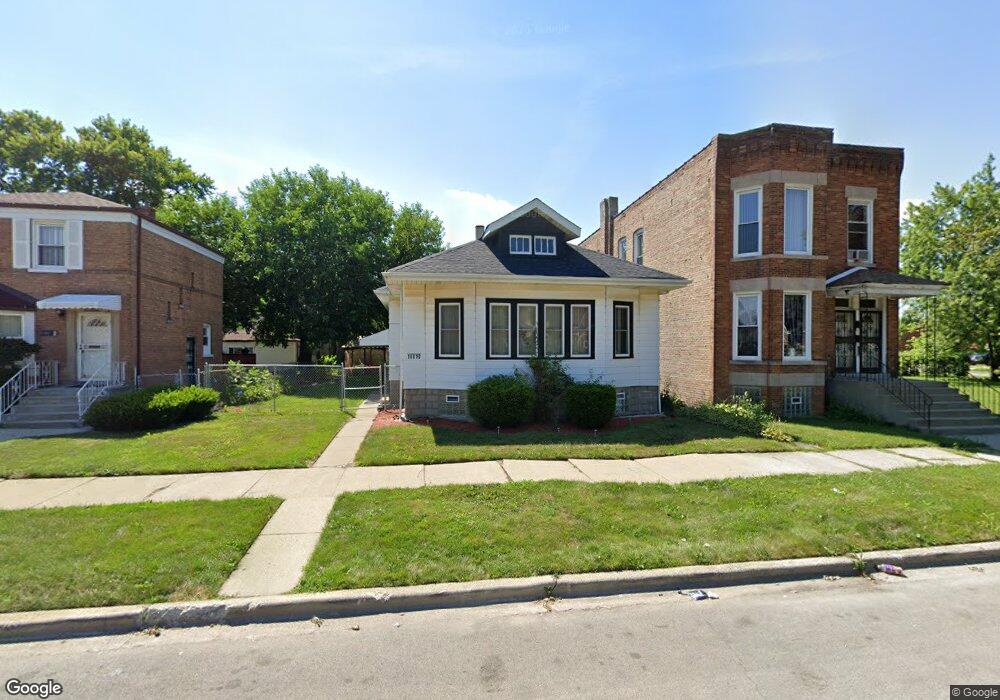
10010 S Emerald Ave Chicago, IL 60628
Roseland NeighborhoodEstimated Value: $141,000 - $176,000
3
Beds
1
Bath
1,226
Sq Ft
$131/Sq Ft
Est. Value
About This Home
This home is located at 10010 S Emerald Ave, Chicago, IL 60628 and is currently estimated at $160,362, approximately $130 per square foot. 10010 S Emerald Ave is a home located in Cook County with nearby schools including Fernwood Elementary School, Julian High School, and St. Margaret of Scotland School.
Ownership History
Date
Name
Owned For
Owner Type
Purchase Details
Closed on
Sep 14, 2021
Sold by
Com Tel Ltd
Bought by
Slater Legacy Ii Llc
Current Estimated Value
Home Financials for this Owner
Home Financials are based on the most recent Mortgage that was taken out on this home.
Original Mortgage
$195,000
Interest Rate
2.7%
Mortgage Type
Purchase Money Mortgage
Purchase Details
Closed on
Sep 4, 2015
Sold by
Bozeman Joan M
Bought by
Com Tei Ltd
Purchase Details
Closed on
May 13, 2002
Sold by
Bozeman Phillip
Bought by
Bozeman Joan
Home Financials for this Owner
Home Financials are based on the most recent Mortgage that was taken out on this home.
Original Mortgage
$80,750
Interest Rate
7.16%
Mortgage Type
Purchase Money Mortgage
Purchase Details
Closed on
Jun 19, 1995
Sold by
Perkins Ruby H
Bought by
Bozeman Phillip W
Home Financials for this Owner
Home Financials are based on the most recent Mortgage that was taken out on this home.
Original Mortgage
$64,600
Interest Rate
8.27%
Mortgage Type
Purchase Money Mortgage
Create a Home Valuation Report for This Property
The Home Valuation Report is an in-depth analysis detailing your home's value as well as a comparison with similar homes in the area
Home Values in the Area
Average Home Value in this Area
Purchase History
| Date | Buyer | Sale Price | Title Company |
|---|---|---|---|
| Slater Legacy Ii Llc | $105,000 | First American Title | |
| Com Tei Ltd | $10,000 | 1St American Title | |
| Bozeman Joan | $85,000 | Chicago Title Insurance Co | |
| Bozeman Phillip W | $102,000 | 1St American Title |
Source: Public Records
Mortgage History
| Date | Status | Borrower | Loan Amount |
|---|---|---|---|
| Closed | Slater Legacy Ii Llc | $195,000 | |
| Previous Owner | Bozeman Joan | $80,750 | |
| Previous Owner | Bozeman Phillip W | $64,600 |
Source: Public Records
Tax History
| Year | Tax Paid | Tax Assessment Tax Assessment Total Assessment is a certain percentage of the fair market value that is determined by local assessors to be the total taxable value of land and additions on the property. | Land | Improvement |
|---|---|---|---|---|
| 2025 | $1,375 | $11,000 | $3,750 | $7,250 |
| 2024 | $1,375 | $11,000 | $3,750 | $7,250 |
| 2023 | $1,341 | $6,501 | $3,438 | $3,063 |
| 2022 | $1,341 | $6,501 | $3,438 | $3,063 |
| 2021 | $639 | $6,499 | $3,437 | $3,062 |
| 2020 | $1,637 | $10,432 | $3,437 | $6,995 |
| 2019 | $1,618 | $11,464 | $3,437 | $8,027 |
| 2018 | $1,590 | $11,464 | $3,437 | $8,027 |
| 2017 | $1,828 | $11,847 | $3,125 | $8,722 |
| 2016 | $1,877 | $11,847 | $3,125 | $8,722 |
| 2015 | $1,694 | $11,847 | $3,125 | $8,722 |
| 2014 | $1,549 | $10,894 | $2,812 | $8,082 |
| 2013 | $1,507 | $10,894 | $2,812 | $8,082 |
Source: Public Records
Map
Nearby Homes
- 10020 S Union Ave
- 10106 S Union Ave
- 10041 S Peoria St
- 10154 S Emerald Ave
- 9941 S Lowe Ave
- 10130 S Lowe Ave
- 10137 S Peoria St
- 9911 S Peoria St
- 10215 S Emerald Ave
- 9900 S Wallace St
- 10100 S Parnell Ave
- 10037 S Morgan St
- 433 W 100th St
- 10342 S Lowe Ave
- 1107 W 101st St
- 10356 S Green St
- 1005 W 103rd St
- 10404 S Emerald Ave
- 431 W 98th St
- 500 W 103rd Place
- 10004 S Emerald Ave Unit 1
- 10018 S Emerald Ave
- 10020 S Emerald Ave
- 10000 S Emerald Ave
- 10022 S Emerald Ave
- 10024 S Emerald Ave
- 10026 S Emerald Ave
- 10009 S Emerald Ave
- 10019 S Emerald Ave
- 10007 S Emerald Ave
- 10030 S Emerald Ave
- 10023 S Emerald Ave
- 9956 S Emerald Ave
- 10001 S Emerald Ave
- 10027 S Emerald Ave
- 9952 S Emerald Ave
- 10031 S Emerald Ave
- 9999 99999
- 10038 S Emerald Ave
- 9950 S Emerald Ave
Your Personal Tour Guide
Ask me questions while you tour the home.