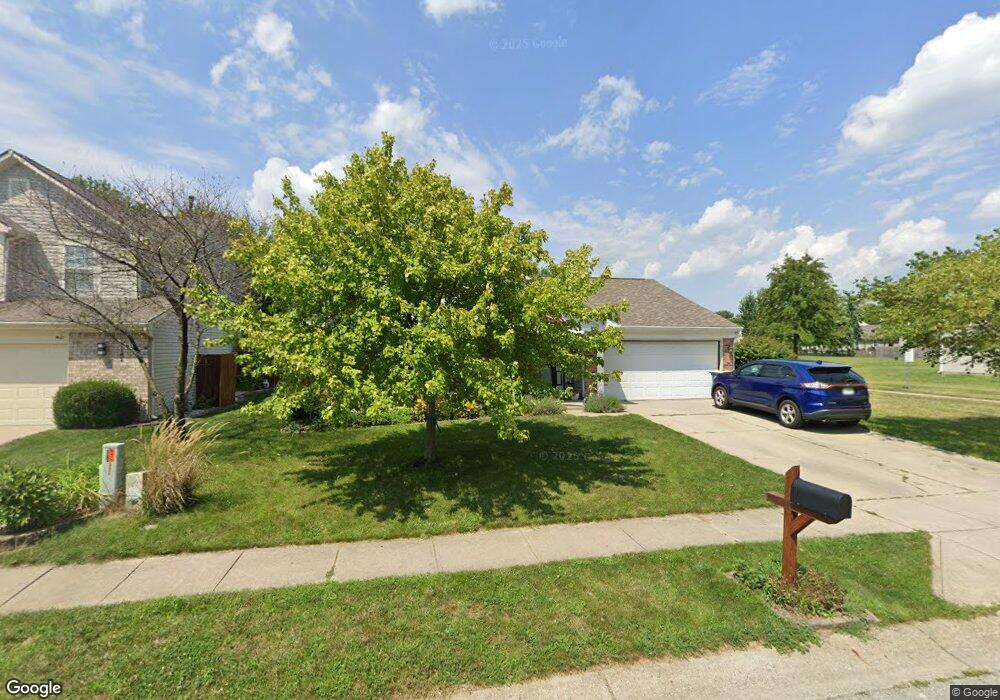
10010 Weeping Cherry Dr Fishers, IN 46038
Estimated Value: $296,203 - $314,000
3
Beds
2
Baths
1,500
Sq Ft
$202/Sq Ft
Est. Value
About This Home
This home is located at 10010 Weeping Cherry Dr, Fishers, IN 46038 and is currently estimated at $303,051, approximately $202 per square foot. 10010 Weeping Cherry Dr is a home located in Hamilton County with nearby schools including Harrison Parkway Elementary School, Kinsey Elementary School, and Fishers Junior High School.
Ownership History
Date
Name
Owned For
Owner Type
Purchase Details
Closed on
Apr 12, 2006
Sold by
Ralston Danielle Y
Bought by
Witt Jo Ellen K
Current Estimated Value
Home Financials for this Owner
Home Financials are based on the most recent Mortgage that was taken out on this home.
Original Mortgage
$124,053
Outstanding Balance
$71,782
Interest Rate
6.48%
Mortgage Type
FHA
Estimated Equity
$231,269
Purchase Details
Closed on
Jun 29, 2001
Sold by
Arbor Homes Llc
Bought by
Ralston Danielle Y
Home Financials for this Owner
Home Financials are based on the most recent Mortgage that was taken out on this home.
Original Mortgage
$115,374
Interest Rate
7.16%
Mortgage Type
FHA
Purchase Details
Closed on
Mar 23, 2001
Sold by
Stafford Development Inc
Bought by
Arbor Homes Llc
Create a Home Valuation Report for This Property
The Home Valuation Report is an in-depth analysis detailing your home's value as well as a comparison with similar homes in the area
Home Values in the Area
Average Home Value in this Area
Purchase History
| Date | Buyer | Sale Price | Title Company |
|---|---|---|---|
| Witt Jo Ellen K | -- | None Available | |
| Ralston Danielle Y | -- | -- | |
| Arbor Homes Llc | -- | -- |
Source: Public Records
Mortgage History
| Date | Status | Borrower | Loan Amount |
|---|---|---|---|
| Open | Witt Jo Ellen K | $124,053 | |
| Previous Owner | Ralston Danielle Y | $115,374 |
Source: Public Records
Tax History Compared to Growth
Tax History
| Year | Tax Paid | Tax Assessment Tax Assessment Total Assessment is a certain percentage of the fair market value that is determined by local assessors to be the total taxable value of land and additions on the property. | Land | Improvement |
|---|---|---|---|---|
| 2024 | $2,398 | $237,500 | $36,400 | $201,100 |
| 2023 | $2,443 | $232,400 | $36,400 | $196,000 |
| 2022 | $2,194 | $201,600 | $36,400 | $165,200 |
| 2021 | $1,901 | $177,900 | $36,400 | $141,500 |
| 2020 | $1,528 | $151,800 | $32,600 | $119,200 |
| 2019 | $1,442 | $145,900 | $25,200 | $120,700 |
| 2018 | $1,285 | $135,100 | $25,200 | $109,900 |
| 2017 | $1,180 | $129,300 | $25,200 | $104,100 |
| 2016 | $1,087 | $118,500 | $25,200 | $93,300 |
| 2014 | $1,000 | $121,700 | $26,200 | $95,500 |
| 2013 | $1,000 | $122,700 | $26,200 | $96,500 |
Source: Public Records
Map
Nearby Homes
- 9989 Worthington Blvd
- 9904 Worthington Blvd
- 9984 Gentry Dr
- 10182 Orange Blossom Trail
- 10057 Boysenberry Dr
- 10190 Holly Berry Cir
- 9760 Silver Leaf Dr Unit 701
- 14243 Holly Berry Cir
- 10270 Apple Blossom Cir
- 9686 Angelica Dr
- 14205 Shooting Star Dr
- 14041 Mimosa Ct
- 14521 Stewart Cir
- 10055 Plantana Blvd
- 10343 Waveland Cir
- 9887 Cranberry Cir
- 13853 Oak Grove Ct
- 10414 Bicknell Cir
- 10093 Parkshore Dr
- 13854 Meadow Grass Way
- 9998 Weeping Cherry Dr
- 14929 Gentry Dr
- 10034 Weeping Cherry Dr
- 9986 Weeping Cherry Dr
- 14373 Worthington Blvd
- 10009 Weeping Cherry Dr
- 9997 Weeping Cherry Dr
- 10046 Weeping Cherry Dr
- 14385 Worthington Blvd
- 14333 Gentry Dr
- 9985 Weeping Cherry Dr
- 14397 Worthington Blvd
- 14310 Gentry Dr
- 14321 Gentry Dr
- 14368 Forsythia Ln
- 14374 Forsythia Ln
- 14386 Forsythia Ln
- 14409 Worthington Blvd
- 14350 Worthington Blvd
- 9995 Worthington Blvd