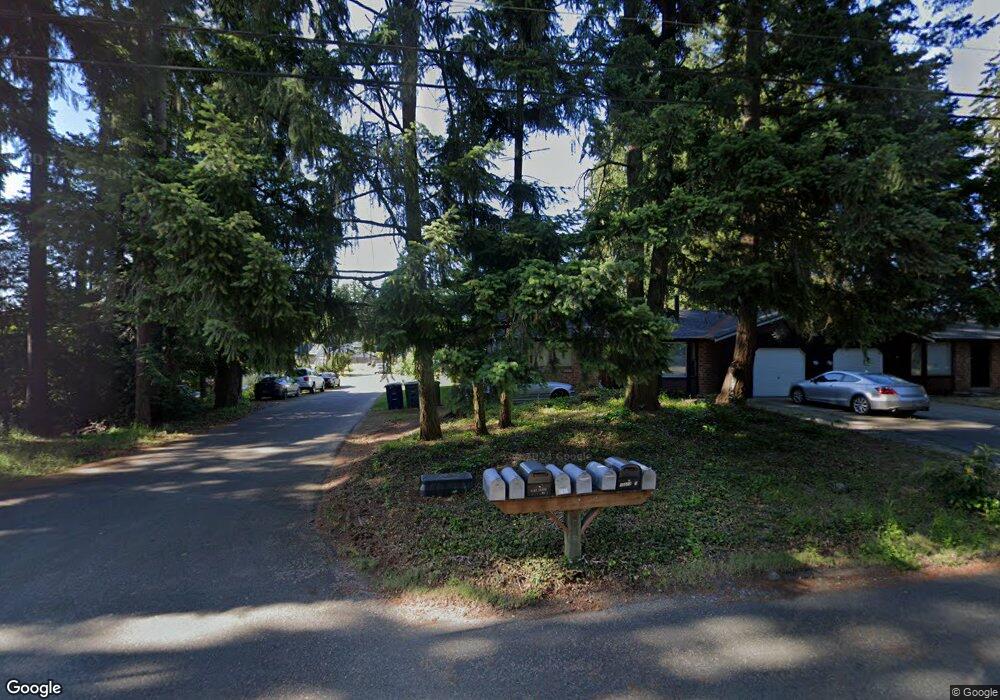
10011 158th St E Puyallup, WA 98375
Estimated Value: $596,788 - $690,000
4
Beds
3
Baths
1,972
Sq Ft
$328/Sq Ft
Est. Value
About This Home
This home is located at 10011 158th St E, Puyallup, WA 98375 and is currently estimated at $647,447, approximately $328 per square foot. 10011 158th St E is a home located in Pierce County with nearby schools including Firgrove Elementary School, Stahl Junior High, and Gov. John Rogers High School.
Ownership History
Date
Name
Owned For
Owner Type
Purchase Details
Closed on
Dec 21, 2018
Sold by
Roberto Joseph S and Roberto Joyce K
Bought by
Held Robert J and Held Karen H
Current Estimated Value
Home Financials for this Owner
Home Financials are based on the most recent Mortgage that was taken out on this home.
Original Mortgage
$267,000
Outstanding Balance
$232,481
Interest Rate
4.9%
Mortgage Type
New Conventional
Estimated Equity
$414,966
Purchase Details
Closed on
Apr 16, 2002
Sold by
Boggs Deric J and Boggs Beth E
Bought by
Roberto Joseph S and Roberto Joyce K
Purchase Details
Closed on
Feb 16, 1999
Sold by
Boggs Deric J
Bought by
Boggs Deric J and Boggs Beth E
Home Financials for this Owner
Home Financials are based on the most recent Mortgage that was taken out on this home.
Original Mortgage
$114,000
Interest Rate
6.77%
Create a Home Valuation Report for This Property
The Home Valuation Report is an in-depth analysis detailing your home's value as well as a comparison with similar homes in the area
Home Values in the Area
Average Home Value in this Area
Purchase History
We collect this data history from publicly available records. To have your information removed, we recommend requesting removal directly through your county’s website.
| Date | Buyer | Sale Price | Title Company |
|---|---|---|---|
| Held Robert J | $356,000 | Chicago Title | |
| Roberto Joseph S | $174,000 | Chicago Title Insurance Comp | |
| Boggs Deric J | -- | Chicago Title Insurance Co |
Source: Public Records
Mortgage History
We collect this data history from publicly available records. To have your information removed, we recommend requesting removal directly through your county’s website.
| Date | Status | Borrower | Loan Amount |
|---|---|---|---|
| Open | Held Robert J | $267,000 | |
| Previous Owner | Boggs Deric J | $114,000 |
Source: Public Records
Tax History
| Year | Tax Paid | Tax Assessment Tax Assessment Total Assessment is a certain percentage of the fair market value that is determined by local assessors to be the total taxable value of land and additions on the property. | Land | Improvement |
|---|---|---|---|---|
| 2025 | $5,531 | $577,500 | $182,600 | $394,900 |
| 2024 | $5,531 | $539,100 | $178,600 | $360,500 |
| 2023 | $5,531 | $521,200 | $178,600 | $342,600 |
| 2022 | $5,122 | $544,800 | $200,200 | $344,600 |
| 2021 | $4,552 | $345,500 | $145,200 | $200,300 |
| 2019 | $4,065 | $324,800 | $119,500 | $205,300 |
| 2018 | $4,108 | $307,700 | $103,800 | $203,900 |
| 2017 | $3,581 | $278,100 | $89,300 | $188,800 |
| 2016 | $3,337 | $219,400 | $70,900 | $148,500 |
| 2014 | $2,895 | $203,600 | $66,100 | $137,500 |
| 2013 | $2,895 | $172,100 | $58,600 | $113,500 |
Source: Public Records
Map
Nearby Homes
- 15717 97th Avenue Ct E
- 9702 159th Street Ct E
- 9707 159th Street Ct E
- 15902 95th Avenue Ct E
- 9317 160th Street Ct E
- 15213 103rd Avenue Ct E
- 9706 164th St E
- 10410 152nd St E
- 15832 92nd Avenue Ct E
- 15306 106th Ave E
- 9320 152nd St E
- 15224 106th Ave E
- 15905 91st Avenue Ct E
- 9122 160th Street Ct E
- 9819 148th Street Ct E
- 9621 148th Street Ct E
- 10701 149th Street Ct E
- 15120 108th Ave E
- 15725 88th Avenue Ct E
- 14817 105th Avenue Ct E
- 9923 158th St E
- 15721 98th Ave E
- 9921 158th St E
- 10013 158th St E Unit 1&2
- 10013 158th St E
- 9914 157th St E
- 9920 157th St E
- 10015 158th St E
- 10015 158th St E
- 9827 158th St E Unit 2
- 9827 158th St E
- 10015 158th St E Unit 10019
- 9904 157th St E
- 10002 158th St E
- 9908 158th St E
- 9824 157th St E
- 10019 158th St E
- 15813 100th Avenue Ct E
- 9819 158th St E
- 15819 100th Avenue Ct E
Your Personal Tour Guide
Ask me questions while you tour the home.