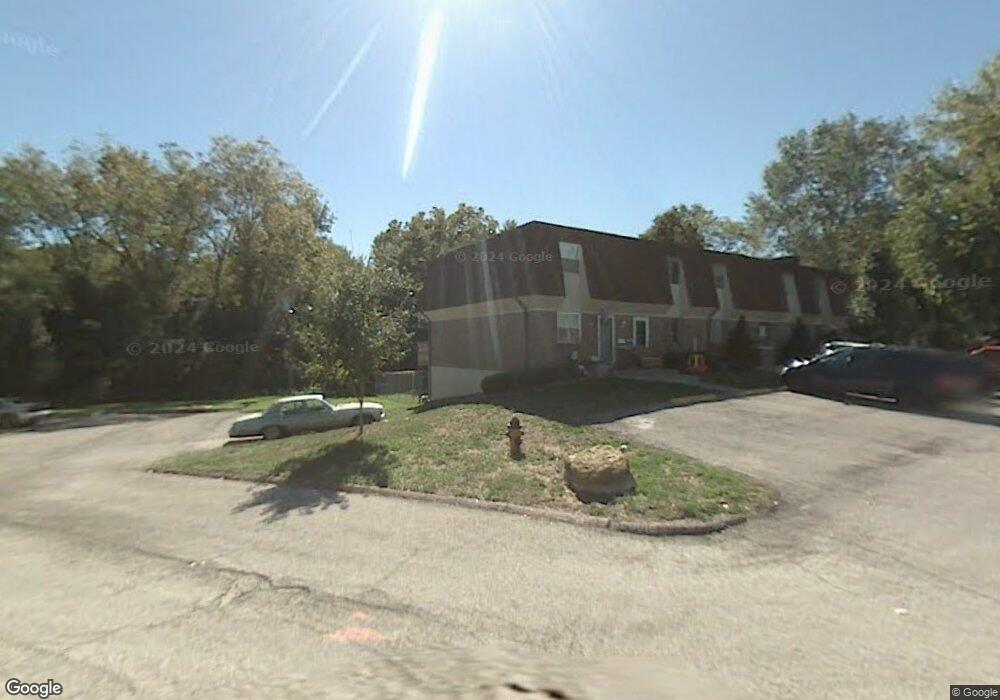
10011 W 52nd St Shawnee, KS 66203
Estimated Value: $124,000 - $188,722
2
Beds
3
Baths
960
Sq Ft
$174/Sq Ft
Est. Value
About This Home
This home is located at 10011 W 52nd St, Shawnee, KS 66203 and is currently estimated at $166,574, approximately $173 per square foot. 10011 W 52nd St is a home located in Johnson County with nearby schools including Merriam Park Elementary School, Hocker Grove Middle School, and Shawnee Mission North High School.
Ownership History
Date
Name
Owned For
Owner Type
Purchase Details
Closed on
Jun 12, 2009
Sold by
Rush Properties Inc
Bought by
Marshall Ila and Odonnell Patrick
Current Estimated Value
Home Financials for this Owner
Home Financials are based on the most recent Mortgage that was taken out on this home.
Original Mortgage
$69,714
Outstanding Balance
$43,999
Interest Rate
4.83%
Mortgage Type
FHA
Estimated Equity
$122,575
Purchase Details
Closed on
Mar 12, 2007
Sold by
Patterson James M and Patterson Amy I
Bought by
Rush Properties Inc
Home Financials for this Owner
Home Financials are based on the most recent Mortgage that was taken out on this home.
Original Mortgage
$41,036
Interest Rate
6.13%
Mortgage Type
Future Advance Clause Open End Mortgage
Purchase Details
Closed on
Oct 22, 2001
Sold by
Pfannenstein Mary M
Bought by
Skibbie Amy I
Create a Home Valuation Report for This Property
The Home Valuation Report is an in-depth analysis detailing your home's value as well as a comparison with similar homes in the area
Home Values in the Area
Average Home Value in this Area
Purchase History
| Date | Buyer | Sale Price | Title Company |
|---|---|---|---|
| Marshall Ila | -- | Homestead Title | |
| Rush Properties Inc | -- | Homestead Title | |
| Skibbie Amy I | -- | Columbian National Title Ins |
Source: Public Records
Mortgage History
| Date | Status | Borrower | Loan Amount |
|---|---|---|---|
| Open | Marshall Ila | $69,714 | |
| Previous Owner | Rush Properties Inc | $41,036 |
Source: Public Records
Tax History Compared to Growth
Tax History
| Year | Tax Paid | Tax Assessment Tax Assessment Total Assessment is a certain percentage of the fair market value that is determined by local assessors to be the total taxable value of land and additions on the property. | Land | Improvement |
|---|---|---|---|---|
| 2024 | $1,869 | $18,262 | $2,792 | $15,470 |
| 2023 | $1,171 | $11,765 | $1,998 | $9,767 |
| 2022 | $1,116 | $10,810 | $1,670 | $9,140 |
| 2021 | $1,116 | $10,154 | $1,344 | $8,810 |
| 2020 | $974 | $8,763 | $1,344 | $7,419 |
| 2019 | $920 | $8,291 | $1,344 | $6,947 |
| 2018 | $934 | $8,372 | $1,344 | $7,028 |
| 2017 | $991 | $8,728 | $1,344 | $7,384 |
| 2016 | $1,036 | $9,004 | $1,344 | $7,660 |
| 2015 | $1,001 | $8,774 | $1,344 | $7,430 |
| 2013 | -- | $8,107 | $1,344 | $6,763 |
Source: Public Records
Map
Nearby Homes
- 9929 W 52nd St
- 10116 W 52nd Terrace
- 9719 W 53rd St
- 5003 Knox Ave
- 5220 Hayes St
- 9328 W 51st St
- 0 W 49th St
- 10511 W 49th Place
- Ashwood Plan at Bristol Highlands - North
- The Fleetwood Plan at Bristol Highlands - The Villas
- Cypress II Plan at Bristol Highlands - North
- The Fleetwood Plan at Bristol Highlands - The Manors
- The Brentwood Plan at Bristol Highlands - The Villas
- Yorkshire V Plan at Bristol Highlands - North
- The Kirkwood Plan at Bristol Highlands - The Villas
- 8013 Payne St
- The Rockwood Plan at Bristol Highlands - The Villas
- Magnolia Plan at Bristol Highlands - North
- 5517 Hayes St
- 9201 W 48th Terrace
- 10013 W 52nd St
- 10009 W 52nd St
- 10017 W 52nd St
- 10019 W 52nd St
- 10021 W 52nd St
- 10023 W 52nd St
- 10027 W 52nd St
- 9947 W 52nd St
- 10016 W 52nd Terrace
- 9941 W 52nd St
- 10020 W 52nd Terrace
- 9939 W 52nd St
- 10010 W 52nd St
- 10014 W 52nd St
- 10008 W 52nd St
- 10012 W 52nd Terrace
- 10018 W 52nd St
- 10004 W 52nd St
- 10024 W 52nd St
- 10020 W 52nd St