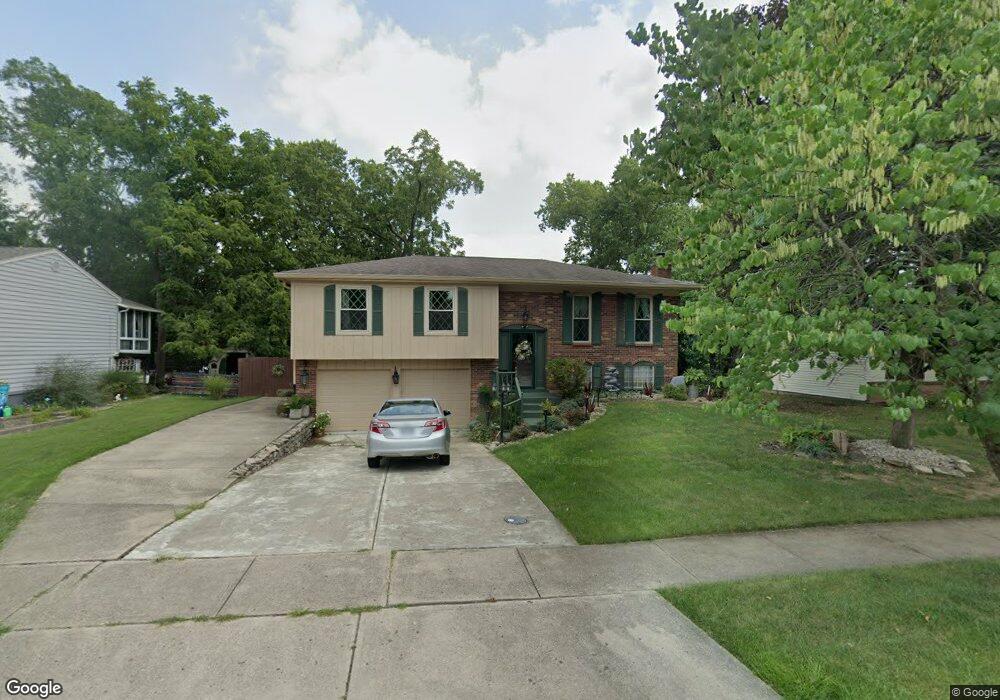
10016 Fernhaven Ct Cincinnati, OH 45251
Northgate NeighborhoodEstimated Value: $250,000 - $268,000
3
Beds
3
Baths
1,650
Sq Ft
$157/Sq Ft
Est. Value
About This Home
This home is located at 10016 Fernhaven Ct, Cincinnati, OH 45251 and is currently estimated at $258,764, approximately $156 per square foot. 10016 Fernhaven Ct is a home located in Hamilton County with nearby schools including Colerain Elementary School, Colerain Middle School, and Colerain High School.
Ownership History
Date
Name
Owned For
Owner Type
Purchase Details
Closed on
Feb 14, 2005
Sold by
Anton Wendy
Bought by
Anton William and Anton Wendy
Current Estimated Value
Home Financials for this Owner
Home Financials are based on the most recent Mortgage that was taken out on this home.
Original Mortgage
$137,809
Outstanding Balance
$69,862
Interest Rate
5.71%
Mortgage Type
New Conventional
Estimated Equity
$188,902
Purchase Details
Closed on
Sep 27, 2000
Sold by
Best James J
Bought by
Anton Wendy
Home Financials for this Owner
Home Financials are based on the most recent Mortgage that was taken out on this home.
Original Mortgage
$104,400
Interest Rate
7.18%
Purchase Details
Closed on
Apr 21, 1995
Sold by
Ford Donald J and Ford Stephanie M
Bought by
Best James J
Home Financials for this Owner
Home Financials are based on the most recent Mortgage that was taken out on this home.
Original Mortgage
$93,952
Interest Rate
8.64%
Mortgage Type
FHA
Create a Home Valuation Report for This Property
The Home Valuation Report is an in-depth analysis detailing your home's value as well as a comparison with similar homes in the area
Home Values in the Area
Average Home Value in this Area
Purchase History
| Date | Buyer | Sale Price | Title Company |
|---|---|---|---|
| Anton William | -- | Omni Land Title Agency Llc | |
| Anton Wendy | $116,000 | -- | |
| Best James J | -- | -- |
Source: Public Records
Mortgage History
| Date | Status | Borrower | Loan Amount |
|---|---|---|---|
| Open | Anton William | $137,809 | |
| Previous Owner | Anton Wendy | $104,400 | |
| Previous Owner | Best James J | $93,952 |
Source: Public Records
Tax History Compared to Growth
Tax History
| Year | Tax Paid | Tax Assessment Tax Assessment Total Assessment is a certain percentage of the fair market value that is determined by local assessors to be the total taxable value of land and additions on the property. | Land | Improvement |
|---|---|---|---|---|
| 2024 | $3,502 | $64,974 | $8,701 | $56,273 |
| 2023 | $3,522 | $64,974 | $8,701 | $56,273 |
| 2022 | $2,893 | $43,456 | $7,672 | $35,784 |
| 2021 | $2,867 | $43,456 | $7,672 | $35,784 |
| 2020 | $2,897 | $43,456 | $7,672 | $35,784 |
| 2019 | $2,507 | $35,046 | $6,188 | $28,858 |
| 2018 | $2,252 | $35,046 | $6,188 | $28,858 |
| 2017 | $2,135 | $35,046 | $6,188 | $28,858 |
| 2016 | $2,477 | $40,247 | $6,248 | $33,999 |
| 2015 | $2,501 | $40,247 | $6,248 | $33,999 |
| 2014 | $2,506 | $40,247 | $6,248 | $33,999 |
| 2013 | $2,516 | $42,365 | $6,577 | $35,788 |
Source: Public Records
Map
Nearby Homes
- 10005 Fairglen Dr
- 3244 Springdale Rd
- 10251 October Dr
- 3545 Alamosa Dr
- 10311 September Dr
- 10356 Mae Ct
- 10364 Mae Ct
- 10368 Mae Ct
- 3374 Deshler Dr
- 10372 Mae Ct
- 10376 Mae Ct
- 3276 Deshler Dr
- 9828 Loralinda Dr
- 3351 Deshler Dr
- Pearson Plan at Villas at Taylor Glen
- 3275 Deshler Dr
- 3376 New Year Dr
- 3374 New Year Dr
- 3358 New Year Dr
- 3356 New Year Dr
- 10010 Fernhaven Ct
- 10022 Fernhaven Ct
- 10004 Fernhaven Ct
- 10028 Fernhaven Ct
- 10017 Fernhaven Ct
- 10023 Fernhaven Ct
- 10011 Fernhaven Ct
- 10000 Fernhaven Ct
- 10029 Fernhaven Ct
- 10005 Fernhaven Ct
- 10034 Fernhaven Ct
- 3308 Springdale Rd
- 10018 Loralinda Dr
- 10040 Fernhaven Ct
- 10024 Loralinda Dr
- 10012 Loralinda Dr
- 9996 Fernhaven Ct
- 10035 Fernhaven Ct
- 10041 Fernhaven Ct
- 10030 Loralinda Dr