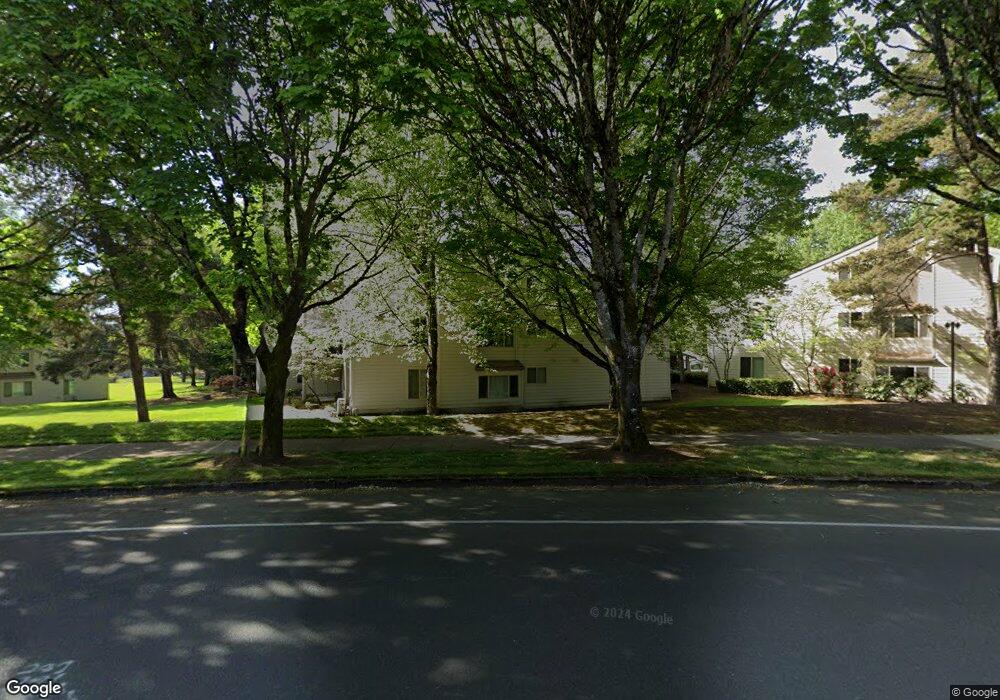
10017 SW Trapper Terrace Unit 20451N Beaverton, OR 97008
Greenway NeighborhoodEstimated Value: $260,000 - $287,000
2
Beds
2
Baths
1,181
Sq Ft
$235/Sq Ft
Est. Value
About This Home
This home is located at 10017 SW Trapper Terrace Unit 20451N, Beaverton, OR 97008 and is currently estimated at $277,065, approximately $234 per square foot. 10017 SW Trapper Terrace Unit 20451N is a home located in Washington County with nearby schools including Greenway Elementary School, Conestoga Middle School, and Southridge High School.
Ownership History
Date
Name
Owned For
Owner Type
Purchase Details
Closed on
Aug 30, 2016
Sold by
Us Bank Trust Na
Bought by
Parr Alice Noel
Current Estimated Value
Home Financials for this Owner
Home Financials are based on the most recent Mortgage that was taken out on this home.
Original Mortgage
$145,500
Outstanding Balance
$115,588
Interest Rate
3.43%
Mortgage Type
New Conventional
Estimated Equity
$161,477
Purchase Details
Closed on
Jan 26, 2016
Sold by
Myers Thuy N
Bought by
U S Bank Trust Na
Purchase Details
Closed on
Dec 2, 2004
Sold by
Satoh Osamu
Bought by
Myers Thuy N
Home Financials for this Owner
Home Financials are based on the most recent Mortgage that was taken out on this home.
Original Mortgage
$87,920
Interest Rate
4%
Mortgage Type
FHA
Create a Home Valuation Report for This Property
The Home Valuation Report is an in-depth analysis detailing your home's value as well as a comparison with similar homes in the area
Home Values in the Area
Average Home Value in this Area
Purchase History
| Date | Buyer | Sale Price | Title Company |
|---|---|---|---|
| Parr Alice Noel | $150,000 | Fidelity Natl Title Of Or | |
| U S Bank Trust Na | $115,865 | None Available | |
| Myers Thuy N | $109,900 | Chicago Title Co |
Source: Public Records
Mortgage History
| Date | Status | Borrower | Loan Amount |
|---|---|---|---|
| Open | Parr Alice Noel | $145,500 | |
| Previous Owner | Myers Thuy N | $87,920 | |
| Closed | Myers Thuy N | $16,485 |
Source: Public Records
Tax History Compared to Growth
Tax History
| Year | Tax Paid | Tax Assessment Tax Assessment Total Assessment is a certain percentage of the fair market value that is determined by local assessors to be the total taxable value of land and additions on the property. | Land | Improvement |
|---|---|---|---|---|
| 2026 | $2,959 | $144,430 | -- | -- |
| 2025 | $2,959 | $140,230 | -- | -- |
| 2024 | $2,794 | $136,150 | -- | -- |
| 2023 | $2,794 | $132,190 | $0 | $0 |
| 2022 | $2,674 | $132,190 | $0 | $0 |
| 2021 | $2,580 | $124,610 | $0 | $0 |
| 2020 | $2,502 | $120,990 | $0 | $0 |
| 2019 | $2,423 | $117,470 | $0 | $0 |
| 2018 | $2,346 | $114,050 | $0 | $0 |
| 2017 | $2,258 | $110,730 | $0 | $0 |
| 2016 | $2,140 | $107,510 | $0 | $0 |
| 2015 | $1,994 | $104,380 | $0 | $0 |
| 2014 | $1,983 | $101,340 | $0 | $0 |
Source: Public Records
Map
Nearby Homes
- 12062 SW Conestoga Dr Unit 6
- 10137 SW Trapper Terrace
- 10196 SW Trapper Terrace Unit 165
- 9964 SW Trapper Terrace Unit 259
- 10322 SW Trapper Terrace Unit 339D
- 12145 SW Gingham Ln
- 9750 SW Lookout Terrace
- 11746 SW Boones Bend Dr
- 11724 SW Boones Bend Dr
- 11640 SW Boones Bend Dr
- 11656 SW Boones Bend Dr
- 11625 SW Settler Way
- 11255 SW Springwood Dr Unit 3
- 9400 SW Downing Dr
- 18971 SW Hazelwood Loop Unit L-4
- 9625 SW 130th Ave
- 11180 SW 115th Ave
- 10845 SW Summer Lake Dr
- 13180 SW Haystack Dr
- 13250 SW Weir Rd
- 10013 SW Trapper Terrace
- 10035 SW Trapper Terrace
- 10031 SW Trapper Terrace
- 10037 SW Trapper Terrace
- 10015 SW Trapper Terrace
- 10011 SW Trapper Terrace
- 10033 SW Trapper Terrace
- 10027 SW Trapper Terrace
- 10023 SW Trapper Terrace
- 10021 SW Trapper Terrace
- 9905 SW Trapper Terrace
- 9911 SW Trapper Terrace
- 9911 SW Trapper Terrace Unit 73
- 10025 SW Trapper Terrace
- 9903 SW Trapper Te
- 9903 SW Trapper Terrace
- 10043 SW Trapper Terrace
- 9907 SW Trapper Terrace
- 9901 SW Trapper Terrace
- 10105 SW Trapper Terrace