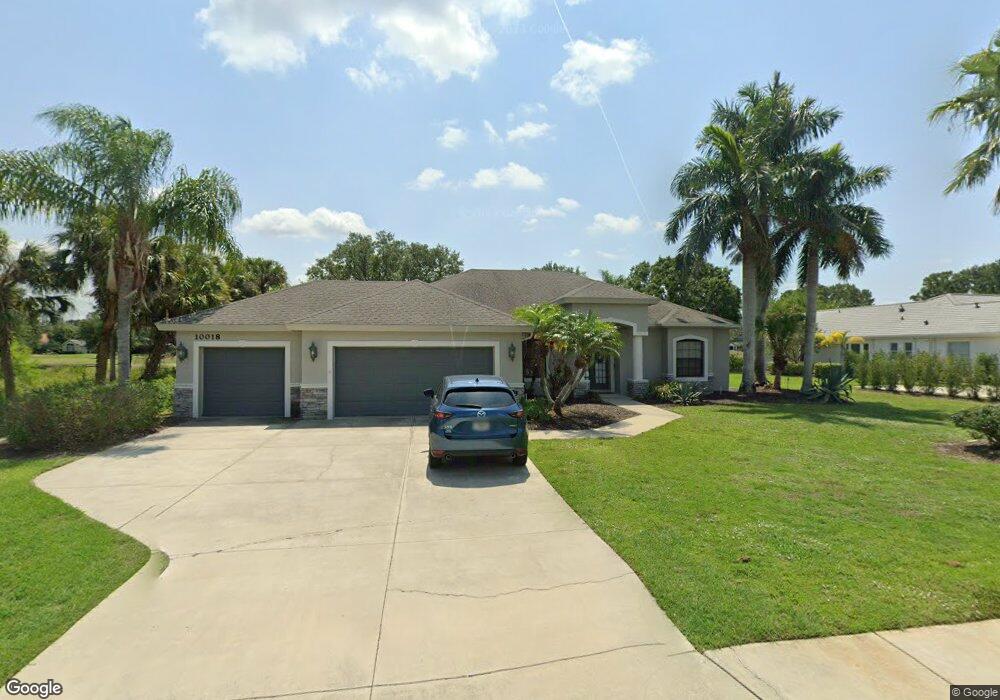
10018 Cherry Hills Avenue Cir Bradenton, FL 34202
Estimated Value: $715,770 - $887,000
4
Beds
3
Baths
3,440
Sq Ft
$232/Sq Ft
Est. Value
About This Home
This home is located at 10018 Cherry Hills Avenue Cir, Bradenton, FL 34202 and is currently estimated at $797,443, approximately $231 per square foot. 10018 Cherry Hills Avenue Cir is a home located in Manatee County with nearby schools including Braden River Elementary School, Lakewood Ranch High School, and Braden River Middle School.
Ownership History
Date
Name
Owned For
Owner Type
Purchase Details
Closed on
Oct 24, 2003
Sold by
Lantz Kelley A
Bought by
Lantz Scott C and Lantz Kelly A
Current Estimated Value
Home Financials for this Owner
Home Financials are based on the most recent Mortgage that was taken out on this home.
Original Mortgage
$322,700
Outstanding Balance
$148,729
Interest Rate
6.03%
Mortgage Type
New Conventional
Estimated Equity
$648,714
Purchase Details
Closed on
Jun 5, 2002
Sold by
Lantz Scott C and Lantz Kelly S
Bought by
Lantz Kelly S
Purchase Details
Closed on
Dec 20, 1999
Sold by
Griffin Ritchie and Griffin Janet M
Bought by
Lantz Scott C
Purchase Details
Closed on
Jan 5, 1999
Sold by
Manatee Joint Venture
Bought by
Griffin Ritchie and Griffin Janet M
Home Financials for this Owner
Home Financials are based on the most recent Mortgage that was taken out on this home.
Original Mortgage
$59,300
Interest Rate
6.77%
Create a Home Valuation Report for This Property
The Home Valuation Report is an in-depth analysis detailing your home's value as well as a comparison with similar homes in the area
Home Values in the Area
Average Home Value in this Area
Purchase History
| Date | Buyer | Sale Price | Title Company |
|---|---|---|---|
| Lantz Scott C | -- | -- | |
| Lantz Kelly S | -- | -- | |
| Lantz Scott C | -- | -- | |
| Lantz Scott C | $73,000 | -- | |
| Griffin Ritchie | $65,900 | -- |
Source: Public Records
Mortgage History
| Date | Status | Borrower | Loan Amount |
|---|---|---|---|
| Open | Lantz Scott C | $322,700 | |
| Previous Owner | Griffin Ritchie | $59,300 |
Source: Public Records
Tax History Compared to Growth
Tax History
| Year | Tax Paid | Tax Assessment Tax Assessment Total Assessment is a certain percentage of the fair market value that is determined by local assessors to be the total taxable value of land and additions on the property. | Land | Improvement |
|---|---|---|---|---|
| 2025 | $9,393 | $640,554 | -- | -- |
| 2024 | $9,393 | $752,074 | $122,400 | $629,674 |
| 2023 | $9,393 | $754,718 | $122,400 | $632,318 |
| 2022 | $8,286 | $635,352 | $120,000 | $515,352 |
| 2021 | $6,598 | $437,507 | $115,000 | $322,507 |
| 2020 | $6,377 | $401,585 | $115,000 | $286,585 |
| 2019 | $6,847 | $427,457 | $115,000 | $312,457 |
| 2018 | $6,859 | $422,425 | $115,000 | $307,425 |
| 2017 | $6,653 | $429,510 | $0 | $0 |
| 2016 | $6,425 | $405,086 | $0 | $0 |
| 2015 | $6,326 | $394,578 | $0 | $0 |
| 2014 | $6,326 | $390,193 | $0 | $0 |
| 2013 | $5,802 | $348,387 | $102,600 | $245,787 |
Source: Public Records
Map
Nearby Homes
- 10002 Cherry Hills Avenue Cir
- 9996 Cherry Hills Avenue Cir
- 10022 Laurel Valley Avenue Cir
- 7302 Dunes Ct
- 9827 Royal Lytham Ave
- 8944 White Sage Loop Unit 3204
- 9024 White Sage Loop
- 9013 White Sage Loop
- 7417 Vista Way Unit 203
- 9008 White Sage Loop Unit 3605
- 6907 River Birch Ct
- 7350 Black Walnut Way Unit 4703
- 8827 White Sage Loop
- 7329 Black Walnut Way
- 7325 Black Walnut Way
- 10228 Silverado Cir
- 8848 White Sage Loop Unit 801
- 10240 Silverado Cir
- 6911 Riversedge Street Cir
- 8821 Manor Loop Unit 101
- 10020 Cherry Hills Avenue Cir
- 10022 Cherry Hills Avenue Cir Unit 1
- 10022 Cherry Hills Avenue Cir
- 10010 Cherry Hills Avenue Cir
- 10021 Cherry Hills Avenue Cir
- 10026 Cherry Hills Avenue Cir
- 10009 Cherry Hills Ave Unit 10009
- 10008 Cherry Hills Avenue Cir
- 10009 Cherry Hills Avenue Cir
- 10025 Cherry Hills Avenue Cir
- 10030 Cherry Hills Avenue Cir
- 10005 Laurel Valley Avenue Cir
- 10009 Laurel Valley Avenue Cir
- 10005 Cherry Hills Avenue Cir
- 10029 Cherry Hills Avenue Cir
- 10006 Cherry Hills Avenue Cir
- 10015 Laurel Valley Avenue Cir
- 10001 Laurel Valley Avenue Cir
- 10019 Laurel Valley Avenue Cir
- 9997 Laurel Valley Avenue Cir