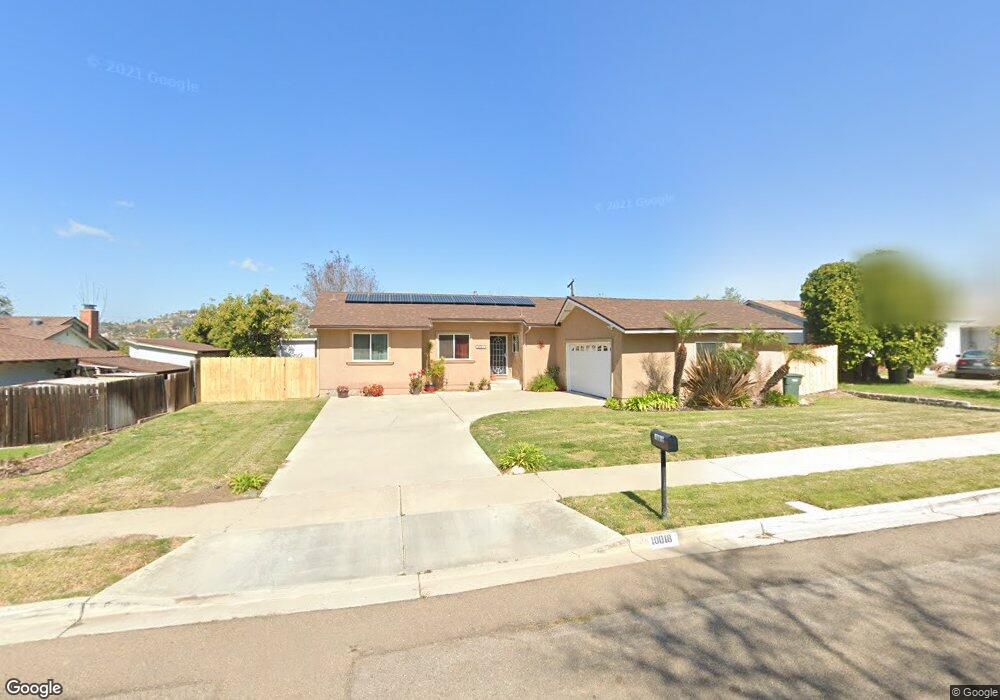
10018 Del Rio Rd Spring Valley, CA 91977
Estimated Value: $729,440 - $840,000
4
Beds
2
Baths
1,489
Sq Ft
$530/Sq Ft
Est. Value
About This Home
This home is located at 10018 Del Rio Rd, Spring Valley, CA 91977 and is currently estimated at $789,110, approximately $529 per square foot. 10018 Del Rio Rd is a home located in San Diego County with nearby schools including Highlands Elementary School, Spring Valley Middle School, and Monte Vista High School.
Ownership History
Date
Name
Owned For
Owner Type
Purchase Details
Closed on
Jul 3, 2019
Sold by
Villalpando Richard and Chaney Rita M
Bought by
Villalpando Stephanie
Current Estimated Value
Purchase Details
Closed on
May 16, 2019
Sold by
Villalpando Marcella Mary and Villalpando Richard
Bought by
Villalpando Stephanie and Villalpando Richard
Purchase Details
Closed on
Jun 29, 2011
Sold by
Villalpando Theresa
Bought by
Villalpando Stephanie
Home Financials for this Owner
Home Financials are based on the most recent Mortgage that was taken out on this home.
Original Mortgage
$183,000
Interest Rate
4.54%
Mortgage Type
New Conventional
Purchase Details
Closed on
Mar 14, 2003
Sold by
Villalpando Stephanie
Bought by
Villalpando Stephanie and Villalpando Theresa
Home Financials for this Owner
Home Financials are based on the most recent Mortgage that was taken out on this home.
Original Mortgage
$123,000
Interest Rate
5.82%
Create a Home Valuation Report for This Property
The Home Valuation Report is an in-depth analysis detailing your home's value as well as a comparison with similar homes in the area
Home Values in the Area
Average Home Value in this Area
Purchase History
| Date | Buyer | Sale Price | Title Company |
|---|---|---|---|
| Villalpando Stephanie | -- | Accommodation | |
| Villalpando Stephanie | -- | Accommodation | |
| Villalpando Stephanie | -- | Corinthian Title Company | |
| Villalpando Stephanie | -- | Commonwealth Land Title Co |
Source: Public Records
Mortgage History
| Date | Status | Borrower | Loan Amount |
|---|---|---|---|
| Closed | Villalpando Stephanie | $183,000 | |
| Closed | Villalpando Stephanie | $123,000 | |
| Closed | Villalpando Stephanie | $50,000 |
Source: Public Records
Tax History Compared to Growth
Tax History
| Year | Tax Paid | Tax Assessment Tax Assessment Total Assessment is a certain percentage of the fair market value that is determined by local assessors to be the total taxable value of land and additions on the property. | Land | Improvement |
|---|---|---|---|---|
| 2025 | $2,655 | $182,037 | $66,592 | $115,445 |
| 2024 | $2,655 | $178,469 | $65,287 | $113,182 |
| 2023 | $2,563 | $174,970 | $64,007 | $110,963 |
| 2022 | $2,509 | $171,540 | $62,752 | $108,788 |
| 2021 | $2,483 | $168,177 | $61,522 | $106,655 |
| 2020 | $2,372 | $166,454 | $60,892 | $105,562 |
| 2019 | $2,330 | $163,192 | $59,699 | $103,493 |
| 2018 | $2,241 | $159,993 | $58,529 | $101,464 |
| 2017 | $832 | $156,857 | $57,382 | $99,475 |
| 2016 | $2,079 | $153,782 | $56,257 | $97,525 |
| 2015 | $2,066 | $151,473 | $55,412 | $96,061 |
| 2014 | $2,031 | $148,507 | $54,327 | $94,180 |
Source: Public Records
Map
Nearby Homes
- 3335 S Barcelona St
- 10021 Sierra Bonita St
- 9938 Buena Vista Dr Unit 14
- 10034 View Crest Ct
- 0 Campo Rd Unit 250030533
- 10051 Casa de Oro Blvd
- 9860 Dale Ave Unit A12
- 9860 Dale Ave Unit D10
- 3254 S Bonita St
- 3135 S Bonita St
- 10351 Don Pico Rd
- 3557 Kenora Dr Unit 22
- 10065 Canyonview Ct
- 3329 Mandy Ln
- 4001 N Bonita St
- 10142 Sierra Madre Rd
- 2811 Glen Canyon Cir Unit 2
- 3598 Quail View St
- 10532 Madrid Way
- 4025 Conrad Dr
- 10010 Del Rio Rd
- 10026 Del Rio Rd
- 10019 Norte Mesa Dr
- 10027 Norte Mesa Dr
- 10011 Norte Mesa Dr
- 10034 Del Rio Rd
- 10002 Del Rio Rd
- 10017 Del Rio Rd
- 10025 Del Rio Rd
- 10035 Norte Mesa Dr
- 10009 Del Rio Rd
- 10003 Norte Mesa Dr
- 10033 Del Rio Rd
- 10042 Del Rio Rd
- 10001 Del Rio Rd
- 10043 Norte Mesa Dr
- 10041 Del Rio Rd
- 10020 Norte Mesa Dr
- 10028 Norte Mesa Dr
- 10012 Norte Mesa Dr