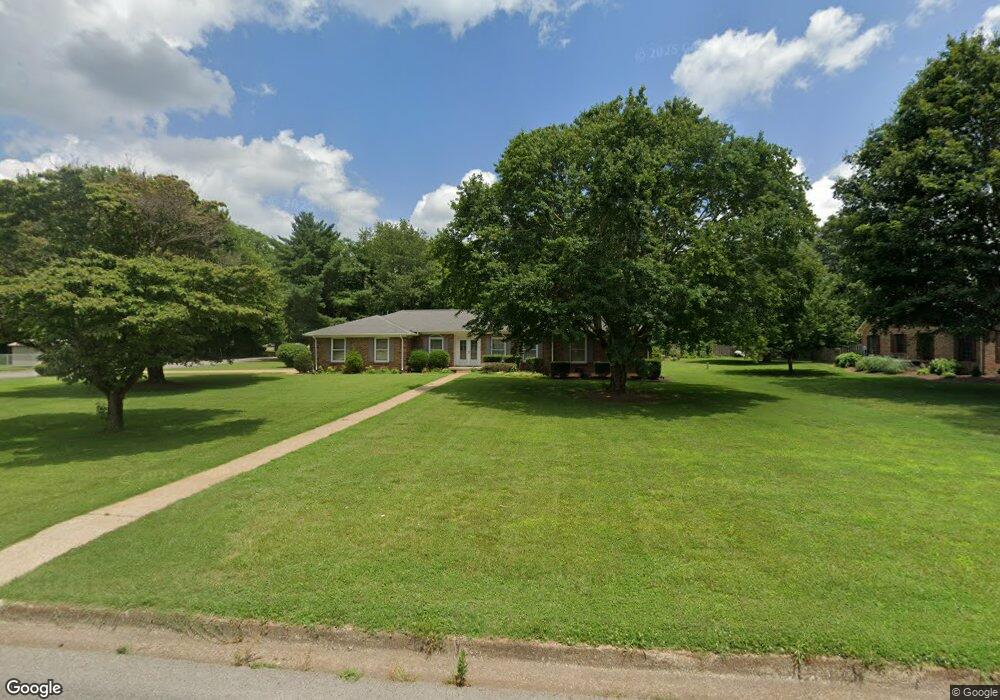
1002 5th Ave Lawrenceburg, TN 38464
Estimated Value: $238,196 - $334,000
--
Bed
2
Baths
1,804
Sq Ft
$162/Sq Ft
Est. Value
About This Home
This home is located at 1002 5th Ave, Lawrenceburg, TN 38464 and is currently estimated at $293,049, approximately $162 per square foot. 1002 5th Ave is a home located in Lawrence County with nearby schools including Ingram Sowell Elementary School, Lawrenceburg Public Elementary School, and David Crockett Elementary School.
Ownership History
Date
Name
Owned For
Owner Type
Purchase Details
Closed on
Jan 20, 2017
Sold by
Paley Edmund J
Bought by
Paley Mark A
Current Estimated Value
Home Financials for this Owner
Home Financials are based on the most recent Mortgage that was taken out on this home.
Original Mortgage
$105,200
Outstanding Balance
$86,928
Interest Rate
4.3%
Mortgage Type
New Conventional
Estimated Equity
$206,121
Purchase Details
Closed on
Feb 10, 1989
Bought by
Paley Edmund J and Paley Eileen
Purchase Details
Closed on
Oct 13, 1975
Bought by
Owens Mabel D Mrs
Create a Home Valuation Report for This Property
The Home Valuation Report is an in-depth analysis detailing your home's value as well as a comparison with similar homes in the area
Home Values in the Area
Average Home Value in this Area
Purchase History
| Date | Buyer | Sale Price | Title Company |
|---|---|---|---|
| Paley Mark A | $131,500 | -- | |
| Paley Edmund J | $84,000 | -- | |
| Owens Mabel D Mrs | -- | -- |
Source: Public Records
Mortgage History
| Date | Status | Borrower | Loan Amount |
|---|---|---|---|
| Open | Paley Mark A | $105,200 |
Source: Public Records
Tax History Compared to Growth
Tax History
| Year | Tax Paid | Tax Assessment Tax Assessment Total Assessment is a certain percentage of the fair market value that is determined by local assessors to be the total taxable value of land and additions on the property. | Land | Improvement |
|---|---|---|---|---|
| 2025 | $1,580 | $50,850 | $0 | $0 |
| 2024 | $1,580 | $50,850 | $5,500 | $45,350 |
| 2023 | $1,580 | $50,850 | $5,500 | $45,350 |
| 2022 | $1,580 | $50,850 | $5,500 | $45,350 |
| 2021 | $1,367 | $31,100 | $3,500 | $27,600 |
| 2020 | $1,367 | $31,100 | $3,500 | $27,600 |
| 2019 | $1,367 | $31,100 | $3,500 | $27,600 |
| 2018 | $1,367 | $31,100 | $3,500 | $27,600 |
| 2017 | $1,367 | $31,100 | $3,500 | $27,600 |
| 2016 | $1,367 | $31,100 | $3,500 | $27,600 |
| 2015 | $1,294 | $31,100 | $3,500 | $27,600 |
| 2014 | $1,218 | $29,275 | $3,500 | $25,775 |
Source: Public Records
Map
Nearby Homes