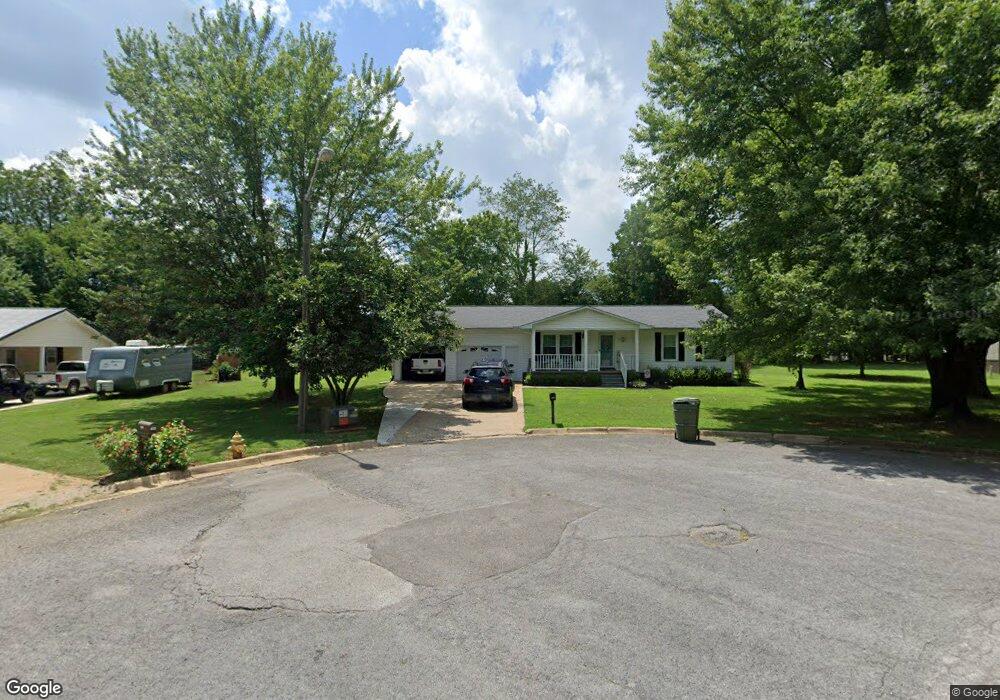
1002 Brazier Ct Lawrenceburg, TN 38464
Estimated Value: $166,133 - $235,000
--
Bed
1
Bath
1,056
Sq Ft
$198/Sq Ft
Est. Value
About This Home
This home is located at 1002 Brazier Ct, Lawrenceburg, TN 38464 and is currently estimated at $208,783, approximately $197 per square foot. 1002 Brazier Ct is a home located in Lawrence County with nearby schools including Ingram Sowell Elementary School, Lawrenceburg Public Elementary School, and David Crockett Elementary School.
Ownership History
Date
Name
Owned For
Owner Type
Purchase Details
Closed on
Aug 29, 2017
Sold by
Elizabeth Waller Sarah
Bought by
Waller Elizabeth and Danoel Luna Benjamin
Current Estimated Value
Home Financials for this Owner
Home Financials are based on the most recent Mortgage that was taken out on this home.
Original Mortgage
$120,000
Outstanding Balance
$99,727
Interest Rate
3.9%
Mortgage Type
Commercial
Estimated Equity
$109,056
Purchase Details
Closed on
Aug 7, 2017
Sold by
Rummage Mia
Bought by
Waller Sarah Elizabeth
Home Financials for this Owner
Home Financials are based on the most recent Mortgage that was taken out on this home.
Original Mortgage
$120,000
Outstanding Balance
$99,727
Interest Rate
3.9%
Mortgage Type
Commercial
Estimated Equity
$109,056
Purchase Details
Closed on
Oct 5, 2012
Sold by
Rosson Mary Edith
Bought by
Rummage Mia
Purchase Details
Closed on
Sep 16, 1985
Bought by
Rosson Floyd D and Wife Edith
Create a Home Valuation Report for This Property
The Home Valuation Report is an in-depth analysis detailing your home's value as well as a comparison with similar homes in the area
Home Values in the Area
Average Home Value in this Area
Purchase History
| Date | Buyer | Sale Price | Title Company |
|---|---|---|---|
| Waller Elizabeth | $54,932 | None Available | |
| Waller Sarah Elizabeth | $110,000 | None Available | |
| Rummage Mia | $60,000 | -- | |
| Rosson Floyd D | -- | -- |
Source: Public Records
Mortgage History
| Date | Status | Borrower | Loan Amount |
|---|---|---|---|
| Open | Waller Sarah Elizabeth | $120,000 |
Source: Public Records
Tax History Compared to Growth
Tax History
| Year | Tax Paid | Tax Assessment Tax Assessment Total Assessment is a certain percentage of the fair market value that is determined by local assessors to be the total taxable value of land and additions on the property. | Land | Improvement |
|---|---|---|---|---|
| 2025 | $935 | $30,075 | $0 | $0 |
| 2024 | $935 | $30,075 | $4,375 | $25,700 |
| 2023 | $935 | $30,075 | $4,375 | $25,700 |
| 2022 | $935 | $30,075 | $4,375 | $25,700 |
| 2021 | $826 | $18,800 | $2,250 | $16,550 |
| 2020 | $826 | $18,800 | $2,250 | $16,550 |
| 2019 | $826 | $18,800 | $2,250 | $16,550 |
| 2018 | $826 | $18,800 | $2,250 | $16,550 |
| 2017 | $661 | $15,400 | $2,250 | $13,150 |
| 2016 | $661 | $15,025 | $2,250 | $12,775 |
| 2015 | $625 | $15,025 | $2,250 | $12,775 |
| 2014 | $624 | $15,000 | $2,250 | $12,750 |
Source: Public Records
Map
Nearby Homes