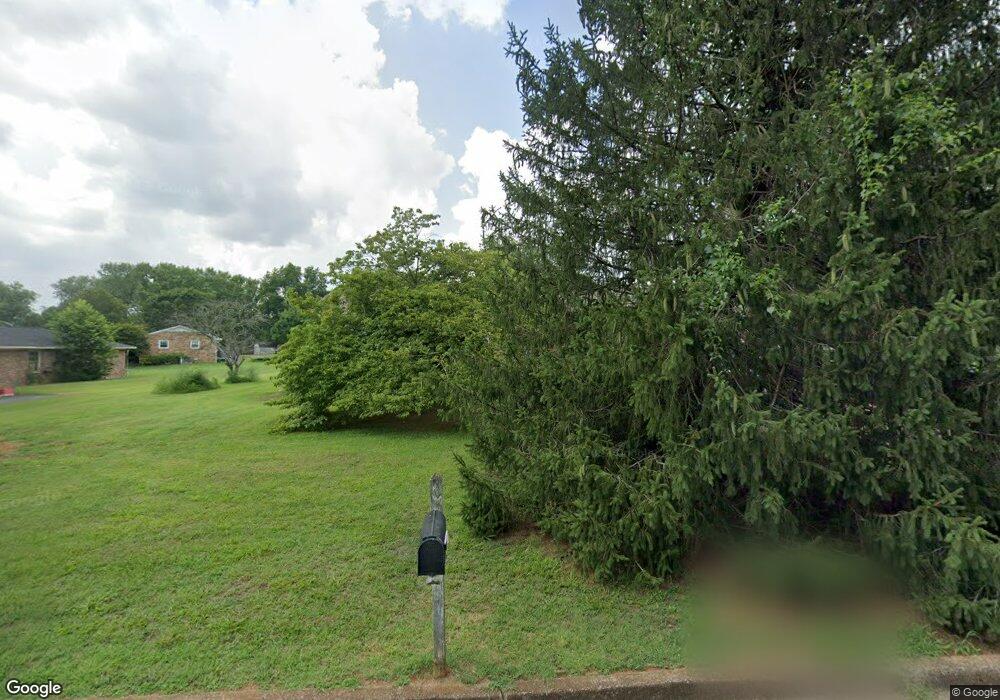
1002 Colston St Lawrenceburg, TN 38464
Estimated Value: $198,000 - $253,000
--
Bed
2
Baths
1,424
Sq Ft
$158/Sq Ft
Est. Value
About This Home
This home is located at 1002 Colston St, Lawrenceburg, TN 38464 and is currently estimated at $225,106, approximately $158 per square foot. 1002 Colston St is a home located in Lawrence County with nearby schools including Ingram Sowell Elementary School, Lawrenceburg Public Elementary School, and David Crockett Elementary School.
Ownership History
Date
Name
Owned For
Owner Type
Purchase Details
Closed on
Nov 19, 2003
Sold by
Patric Fife George
Bought by
Lee Sanford Ronald
Current Estimated Value
Purchase Details
Closed on
Sep 25, 1998
Bought by
Fife George Patric and Fife Emily
Purchase Details
Closed on
Jul 2, 1993
Bought by
Davis James S
Purchase Details
Closed on
Jul 30, 1986
Bought by
Christian Barry
Purchase Details
Closed on
Jan 2, 1900
Create a Home Valuation Report for This Property
The Home Valuation Report is an in-depth analysis detailing your home's value as well as a comparison with similar homes in the area
Home Values in the Area
Average Home Value in this Area
Purchase History
| Date | Buyer | Sale Price | Title Company |
|---|---|---|---|
| Lee Sanford Ronald | $64,000 | -- | |
| Fife George Patric | $70,000 | -- | |
| Davis James S | $62,900 | -- | |
| Christian Barry | -- | -- | |
| -- | -- | -- |
Source: Public Records
Tax History Compared to Growth
Tax History
| Year | Tax Paid | Tax Assessment Tax Assessment Total Assessment is a certain percentage of the fair market value that is determined by local assessors to be the total taxable value of land and additions on the property. | Land | Improvement |
|---|---|---|---|---|
| 2025 | $1,164 | $37,450 | $0 | $0 |
| 2024 | $1,164 | $37,450 | $4,375 | $33,075 |
| 2023 | $1,164 | $37,450 | $4,375 | $33,075 |
| 2022 | $1,164 | $37,450 | $4,375 | $33,075 |
| 2021 | $936 | $21,300 | $2,250 | $19,050 |
| 2020 | $936 | $21,300 | $2,250 | $19,050 |
| 2019 | $936 | $21,300 | $2,250 | $19,050 |
| 2018 | $936 | $21,300 | $2,250 | $19,050 |
| 2017 | $936 | $21,300 | $2,250 | $19,050 |
| 2016 | $936 | $21,300 | $2,250 | $19,050 |
| 2015 | $887 | $21,300 | $2,250 | $19,050 |
| 2014 | $880 | $21,150 | $2,250 | $18,900 |
Source: Public Records
Map
Nearby Homes