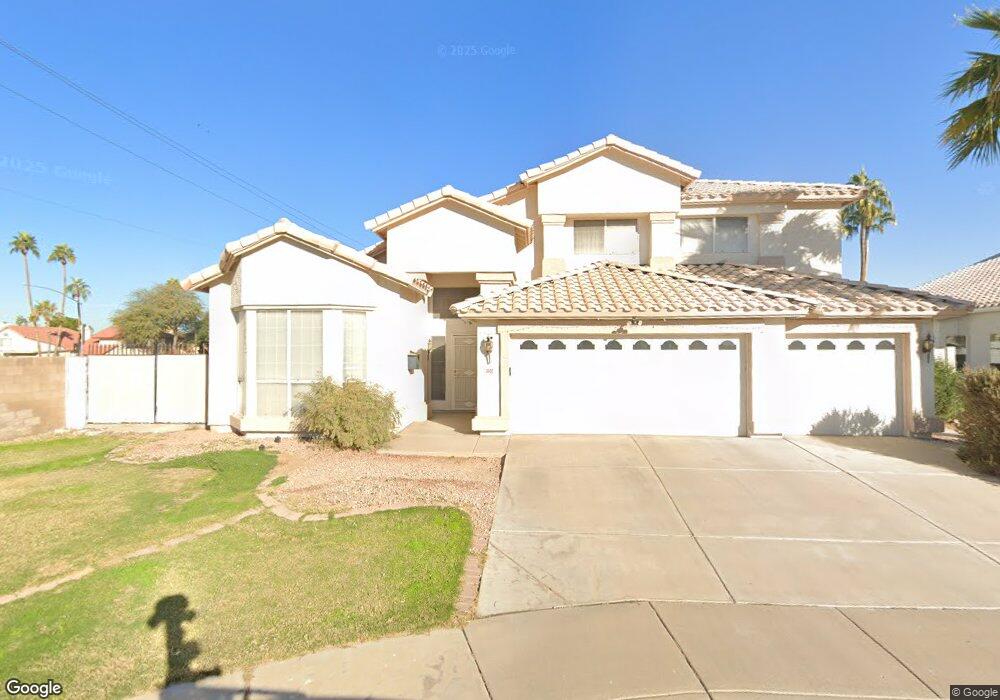
1002 E Kent Place Chandler, AZ 85225
The Islands NeighborhoodEstimated Value: $598,599 - $675,000
4
Beds
3
Baths
2,957
Sq Ft
$219/Sq Ft
Est. Value
About This Home
This home is located at 1002 E Kent Place, Chandler, AZ 85225 and is currently estimated at $646,900, approximately $218 per square foot. 1002 E Kent Place is a home located in Maricopa County with nearby schools including Shumway Elementary School, Willis Junior High School, and Chandler High School.
Ownership History
Date
Name
Owned For
Owner Type
Purchase Details
Closed on
Aug 24, 2006
Sold by
Xu Yao Hui
Bought by
Xu Yao Hui and Xu Shize Zhang
Current Estimated Value
Home Financials for this Owner
Home Financials are based on the most recent Mortgage that was taken out on this home.
Original Mortgage
$378,000
Outstanding Balance
$226,945
Interest Rate
6.76%
Mortgage Type
New Conventional
Estimated Equity
$419,955
Purchase Details
Closed on
May 1, 1996
Sold by
Lara Isaac and Lara Gladys
Bought by
Xu Yaohui and Xu Shize Zhang
Home Financials for this Owner
Home Financials are based on the most recent Mortgage that was taken out on this home.
Original Mortgage
$140,000
Interest Rate
7.8%
Mortgage Type
New Conventional
Purchase Details
Closed on
Jan 19, 1995
Sold by
Pulte Home Corp
Bought by
Lara Isaac and Lara Gladys
Create a Home Valuation Report for This Property
The Home Valuation Report is an in-depth analysis detailing your home's value as well as a comparison with similar homes in the area
Home Values in the Area
Average Home Value in this Area
Purchase History
| Date | Buyer | Sale Price | Title Company |
|---|---|---|---|
| Xu Yao Hui | -- | Transnation Title Ins Co | |
| Xu Yao Hui | -- | Transnation Title Ins Co | |
| Xu Yaohui | $175,000 | Security Title Agency | |
| Lara Isaac | $167,825 | United Title Agency |
Source: Public Records
Mortgage History
| Date | Status | Borrower | Loan Amount |
|---|---|---|---|
| Open | Xu Yao Hui | $378,000 | |
| Closed | Xu Yaohui | $140,000 |
Source: Public Records
Tax History Compared to Growth
Tax History
| Year | Tax Paid | Tax Assessment Tax Assessment Total Assessment is a certain percentage of the fair market value that is determined by local assessors to be the total taxable value of land and additions on the property. | Land | Improvement |
|---|---|---|---|---|
| 2025 | $2,342 | $30,064 | -- | -- |
| 2024 | $2,262 | $28,633 | -- | -- |
| 2023 | $2,262 | $44,480 | $8,890 | $35,590 |
| 2022 | $2,183 | $33,550 | $6,710 | $26,840 |
| 2021 | $2,288 | $32,350 | $6,470 | $25,880 |
| 2020 | $2,277 | $30,420 | $6,080 | $24,340 |
| 2019 | $2,190 | $29,480 | $5,890 | $23,590 |
| 2018 | $2,121 | $28,650 | $5,730 | $22,920 |
| 2017 | $1,977 | $27,510 | $5,500 | $22,010 |
| 2016 | $1,904 | $26,880 | $5,370 | $21,510 |
| 2015 | $1,845 | $26,050 | $5,210 | $20,840 |
Source: Public Records
Map
Nearby Homes
- 955 E Knox Rd Unit 110
- 955 E Knox Rd Unit 137
- 932 E Manor Dr
- 1302 N Bedford Dr
- 1014 E Golden Ct
- 853 E Manor Dr
- 966 E Rockwell Dr Unit 3
- 872 E Baylor Ln
- 1601 N Saba St Unit 318
- 1601 N Saba St Unit 271
- 1214 W Iris Dr
- 919 S Paradise Dr Unit III
- 910 S Paradise Dr
- 1600 N Saba St Unit 224
- 1600 N Saba St Unit 106
- 1600 N Saba St Unit 155
- 1555 W Sea Fog Dr
- 1305 W Lobster Trap Dr
- 668 E Estrella Dr
- 677 E Temple St
- 1012 E Kent Place
- 1537 W Sherri Dr
- 1022 E Kent Place
- 1531 W Sherri Dr
- 1011 E Kent Place
- 1544 W Sherri Dr
- 1032 E Kent Place
- 1525 W Sherri Dr
- 1021 E Kent Place
- 973 E Manor Dr
- 1519 W Sherri Dr
- 1042 E Kent Place
- 1538 W Sherri Dr
- 969 E Manor Dr Unit 3
- 1532 W Sherri Dr
- 965 E Manor Dr Unit 3
- 1526 W Sherri Dr
- 1052 E Kent Place
- 1513 W Sherri Dr
- 961 E Manor Dr