Estimated payment $3,796/month
Highlights
- Traditional Architecture
- Wood Flooring
- Fireplace
- Apex Elementary School Rated A-
- Breakfast Room
- 2 Car Attached Garage
About This Home
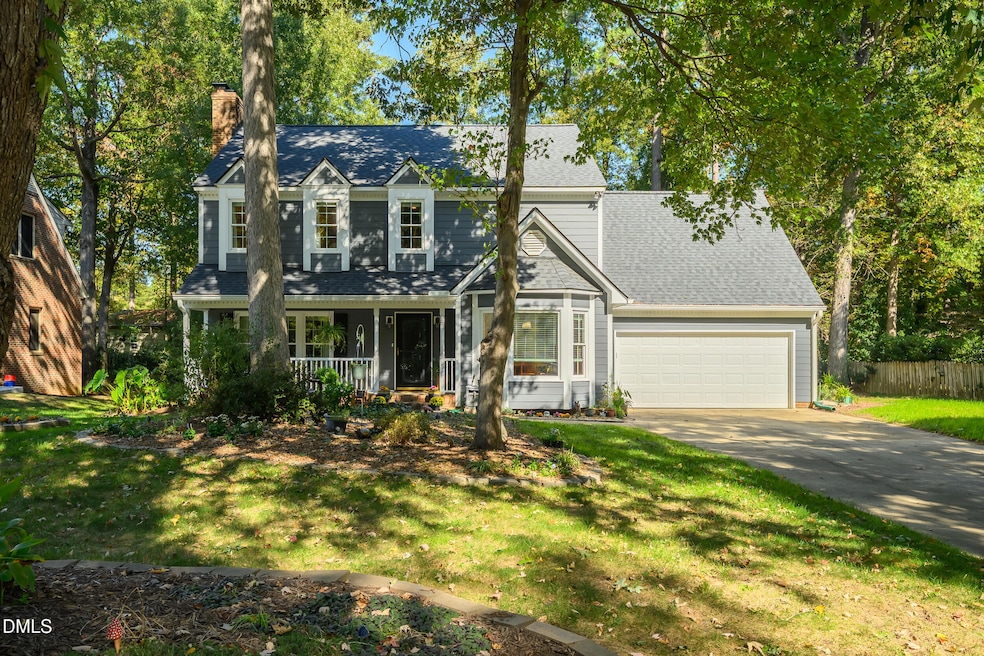
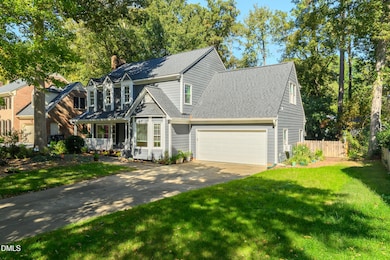
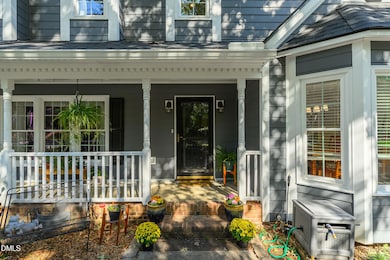
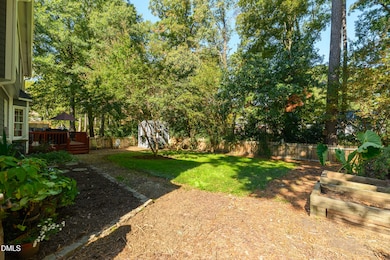
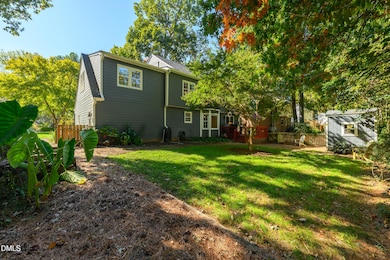
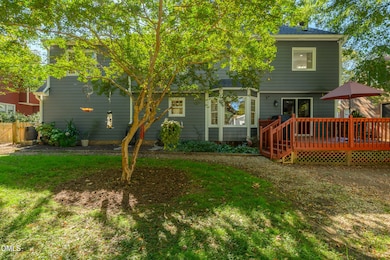
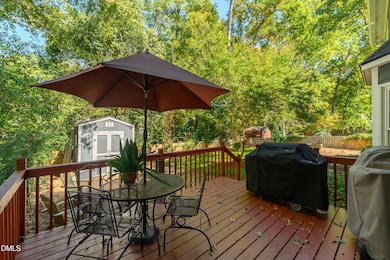
With roots dating back to the Dowd farm of the early 1800s, Shepherd's Vineyard has long been one of Apex's most beloved neighborhoods, known for its wide streets, mature trees, and friendly neighbors who make it feel like home. 1002 Eastham Drive carries on that legacy, combining timeless charm with modern comfort. The main floor features a formal dining room and a large living room centered around a cozy fireplace, perfect for gatherings or quiet evenings in. The kitchen offers an eat-in dining space, granite countertops, and plenty of cabinetry for everyday functionality. Upstairs, you'll find three spacious secondary bedrooms, (or a large bonus room option) and a generous primary suite. The updated primary bathroom includes a soaking tub, walk-in shower, and double vanity, creating a relaxing retreat at the end of the day. Laundry is conveniently located upstairs. Step outside to a private, flat backyard with room for a table and grill on the back deck, along with a storage shed for tools or outdoor gear. Recent updates include a new roof in 2024, replaced windows, new gutters, HVAC 2024 & 2025, hot water heater 2023, and insulation in the crawlspace, providing peace of mind for years to come. This Shepherd's Vineyard classic captures the best of Apex living: character, comfort, and community.
Home Details
Home Type
- Single Family
Est. Annual Taxes
- $4,747
Year Built
- Built in 1989
Lot Details
- 10,019 Sq Ft Lot
HOA Fees
- $30 Monthly HOA Fees
Parking
- 2 Car Attached Garage
Home Design
- Traditional Architecture
- Shingle Roof
- Cement Siding
- Masonite
Interior Spaces
- 2,354 Sq Ft Home
- 2-Story Property
- Fireplace
- Living Room
- Breakfast Room
- Dining Room
- Crawl Space
Flooring
- Wood
- Tile
Bedrooms and Bathrooms
- 4 Bedrooms
- Primary bedroom located on second floor
- Soaking Tub
Schools
- Apex Elementary School
- Apex Middle School
- Apex High School
Utilities
- Central Air
- Heating System Uses Gas
Community Details
- Shepherds Vineyard HOA, Phone Number (919) 848-4911
- Shepherds Vineyard Subdivision
Listing and Financial Details
- Assessor Parcel Number 0742955300
Map
Tax History
| Year | Tax Paid | Tax Assessment Tax Assessment Total Assessment is a certain percentage of the fair market value that is determined by local assessors to be the total taxable value of land and additions on the property. | Land | Improvement |
|---|---|---|---|---|
| 2025 | $4,747 | $541,434 | $200,000 | $341,434 |
| 2024 | $4,641 | $541,434 | $200,000 | $341,434 |
Property History
| Date | Event | Price | List to Sale | Price per Sq Ft |
|---|---|---|---|---|
| 11/02/2025 11/02/25 | Pending | -- | -- | -- |
| 10/23/2025 10/23/25 | For Sale | $635,000 | -- | $270 / Sq Ft |
Purchase History
| Date | Type | Sale Price | Title Company |
|---|---|---|---|
| Warranty Deed | $238,000 | -- | |
| Warranty Deed | $215,000 | -- | |
| Warranty Deed | $205,000 | -- |
Mortgage History
| Date | Status | Loan Amount | Loan Type |
|---|---|---|---|
| Open | $140,000 | Fannie Mae Freddie Mac | |
| Previous Owner | $171,760 | No Value Available | |
| Previous Owner | $184,500 | No Value Available |
Source: Doorify MLS
MLS Number: 10129362
APN: 0742.12-95-5300-000
Disclaimer: Certain information contained herein is derived from information provided by parties other than Homes.com. All information provided is deemed reliable, but is not guaranteed to be accurate and should be independently verified.
![]() Some IDX listings have been excluded from this IDX display. Brokers make an effort to deliver accurate information, but buyers should independently verify any information on which they will rely in a transaction. The listing broker shall not be responsible for any typographical errors, misinformation, or misprints, and they shall be held totally harmless from any damages arising from reliance upon this data. This data is provided exclusively for consumers’ personal, non-commercial use. Listings marked with an icon are provided courtesy of the Doorify MLS, Inc. of North Carolina, Internet Data Exchange Database. Closed (sold) listings may have been listed and/or sold by a real estate firm other than the firm(s) featured on this website. Closed data is not available until the sale of the property is recorded in the MLS. Home sale data is not an appraisal, CMA, competitive or comparative market analysis, or home valuation of any property. Copyright 2026 Doorify MLS, Inc. of North Carolina. All rights reserved.
Some IDX listings have been excluded from this IDX display. Brokers make an effort to deliver accurate information, but buyers should independently verify any information on which they will rely in a transaction. The listing broker shall not be responsible for any typographical errors, misinformation, or misprints, and they shall be held totally harmless from any damages arising from reliance upon this data. This data is provided exclusively for consumers’ personal, non-commercial use. Listings marked with an icon are provided courtesy of the Doorify MLS, Inc. of North Carolina, Internet Data Exchange Database. Closed (sold) listings may have been listed and/or sold by a real estate firm other than the firm(s) featured on this website. Closed data is not available until the sale of the property is recorded in the MLS. Home sale data is not an appraisal, CMA, competitive or comparative market analysis, or home valuation of any property. Copyright 2026 Doorify MLS, Inc. of North Carolina. All rights reserved.
- 203 Pinewood Dr
- 1000 Chimney Hill Dr
- 1309 Empty Nest Way
- 1003 Lathrop Ln
- 823 Richmont Grove Ln
- 810 Richmont Grove Ln
- 904 Dalton Ridge Place
- 3007 Old Raleigh Rd
- 634 Edgewater Ridge Ct
- 345 Great Northern Station
- 1115 Platform Dr
- 1124 Platform Dr
- 811 Amley Place
- 596 Grand Central Station
- 3015 Old Raleigh Rd
- 1808 N Salem St
- 547 Grand Central Station
- 635 Sawcut Ln
- 631 Sawcut Ln
- 633 Sawcut Ln
