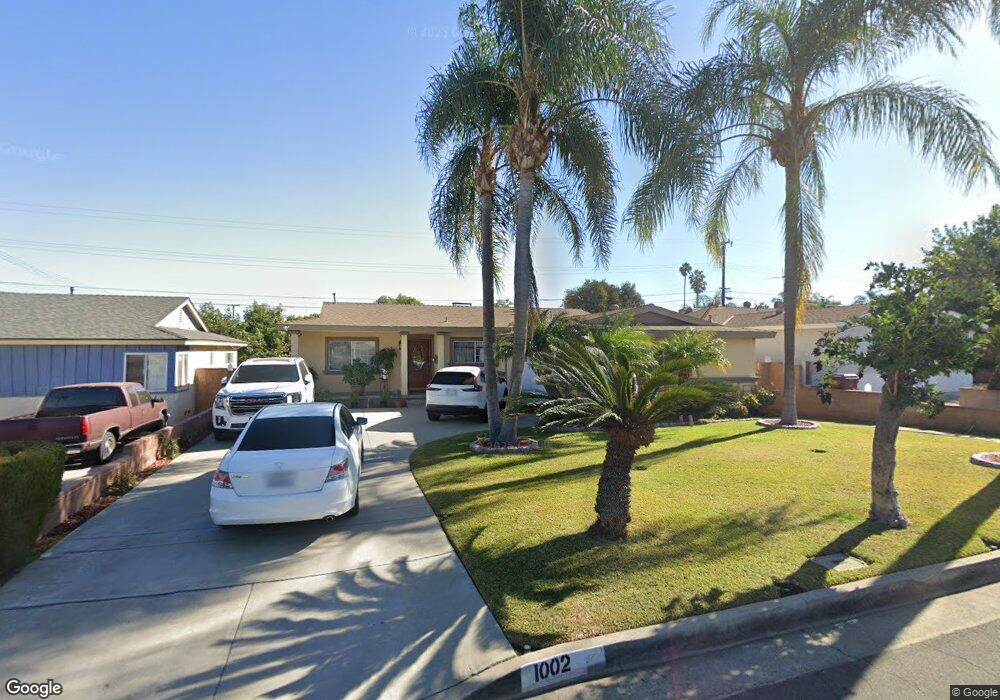
1002 Finegrove Ave Hacienda Heights, CA 91745
Estimated Value: $717,669 - $812,000
3
Beds
2
Baths
1,454
Sq Ft
$535/Sq Ft
Est. Value
About This Home
This home is located at 1002 Finegrove Ave, Hacienda Heights, CA 91745 and is currently estimated at $777,667, approximately $534 per square foot. 1002 Finegrove Ave is a home located in Los Angeles County with nearby schools including Palm Elementary School, Orange Grove Middle School, and Los Altos High School.
Ownership History
Date
Name
Owned For
Owner Type
Purchase Details
Closed on
May 23, 2007
Sold by
Gomez Jose Luis and Gomez Rosa
Bought by
Gomez Jose Luis
Current Estimated Value
Purchase Details
Closed on
Mar 19, 1996
Sold by
Federal National Mortgage Association
Bought by
Gomez Jose Luis and Tena Rosa
Home Financials for this Owner
Home Financials are based on the most recent Mortgage that was taken out on this home.
Original Mortgage
$137,700
Outstanding Balance
$4,685
Interest Rate
7.41%
Mortgage Type
Seller Take Back
Estimated Equity
$772,982
Purchase Details
Closed on
Jan 19, 1996
Sold by
Poblete Arcel D and Dejesus Rizalia D
Bought by
Federal National Mortgage Association
Home Financials for this Owner
Home Financials are based on the most recent Mortgage that was taken out on this home.
Original Mortgage
$137,700
Outstanding Balance
$4,685
Interest Rate
7.41%
Mortgage Type
Seller Take Back
Estimated Equity
$772,982
Create a Home Valuation Report for This Property
The Home Valuation Report is an in-depth analysis detailing your home's value as well as a comparison with similar homes in the area
Home Values in the Area
Average Home Value in this Area
Purchase History
| Date | Buyer | Sale Price | Title Company |
|---|---|---|---|
| Gomez Jose Luis | -- | First American Title Co | |
| Gomez Jose Luis | $142,000 | Landsafe Title | |
| Federal National Mortgage Association | $135,000 | Stewart Title |
Source: Public Records
Mortgage History
| Date | Status | Borrower | Loan Amount |
|---|---|---|---|
| Open | Gomez Jose Luis | $137,700 |
Source: Public Records
Tax History Compared to Growth
Tax History
| Year | Tax Paid | Tax Assessment Tax Assessment Total Assessment is a certain percentage of the fair market value that is determined by local assessors to be the total taxable value of land and additions on the property. | Land | Improvement |
|---|---|---|---|---|
| 2025 | $3,197 | $235,868 | $115,274 | $120,594 |
| 2024 | $3,197 | $231,244 | $113,014 | $118,230 |
| 2023 | $3,121 | $226,711 | $110,799 | $115,912 |
| 2022 | $3,031 | $222,267 | $108,627 | $113,640 |
| 2021 | $2,972 | $217,910 | $106,498 | $111,412 |
| 2020 | $2,934 | $215,676 | $105,406 | $110,270 |
| 2019 | $2,888 | $211,448 | $103,340 | $108,108 |
| 2018 | $2,736 | $207,303 | $101,314 | $105,989 |
| 2016 | $2,529 | $199,255 | $97,381 | $101,874 |
| 2015 | $2,482 | $196,263 | $95,919 | $100,344 |
| 2014 | $2,446 | $192,420 | $94,041 | $98,379 |
Source: Public Records
Map
Nearby Homes
- 1038 Hedgepath Ave
- 14815 Novak St
- 14858 Gale Ave
- 15149 Salt Lake Ave
- 14455 Marwood St
- 15033 Gale Ave
- 901 S 6th Ave Unit 238
- 901 S 6th Ave Unit 159
- 901 S 6th Ave Unit 447
- 901 S 6th Ave Unit 205
- 1138 Valencia Ave Unit 40
- 1314 Ameluxen Ave
- 1139 Turnbull Canyon Rd Unit C
- 1325 Beech Hill Ave
- 1502 Hedgepath Ave
- 1454 Ameluxen Ave
- 15226 Shadybend Dr Unit 32
- 1461 Ameluxen Ave
- 1114 Stovall Ave
- 1610 Golden View Dr
- 1008 Finegrove Ave
- 952 Finegrove Ave
- 963 Latchford Ave
- 957 Latchford Ave
- 969 Latchford Ave
- 1014 Finegrove Ave
- 946 Finegrove Ave
- 1003 Finegrove Ave
- 951 Latchford Ave
- 1003 Latchford Ave
- 1009 Finegrove Ave
- 953 Finegrove Ave
- 1020 Finegrove Ave
- 940 Finegrove Ave
- 1015 Finegrove Ave
- 947 Finegrove Ave
- 1011 Latchford Ave
- 1021 Finegrove Ave
- 941 Finegrove Ave
- 1026 Finegrove Ave