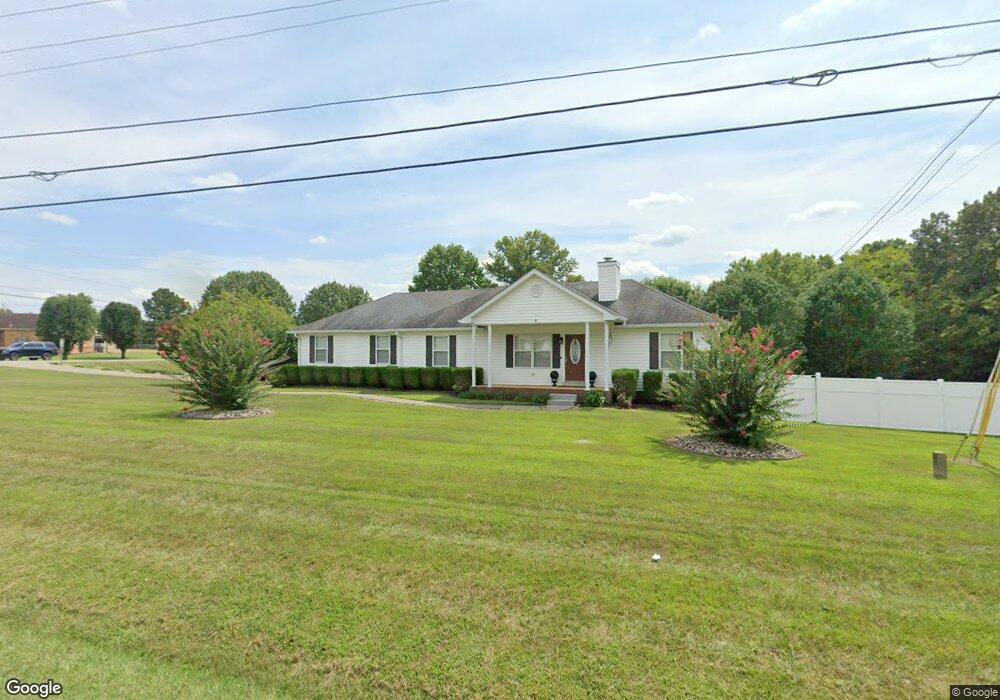
1002 Forest Crossing Joelton, TN 37080
Joelton NeighborhoodEstimated Value: $407,165 - $500,000
--
Bed
2
Baths
1,920
Sq Ft
$231/Sq Ft
Est. Value
About This Home
This home is located at 1002 Forest Crossing, Joelton, TN 37080 and is currently estimated at $444,291, approximately $231 per square foot. 1002 Forest Crossing is a home located in Cheatham County with nearby schools including East Cheatham Elementary School, Cheatham Middle School, and Sycamore High School.
Ownership History
Date
Name
Owned For
Owner Type
Purchase Details
Closed on
May 8, 2006
Sold by
Luke Edward D
Bought by
Luke Edward D and Luke Tracey L
Current Estimated Value
Purchase Details
Closed on
Dec 17, 1998
Sold by
Luke Edward D
Bought by
Luke Edward D
Home Financials for this Owner
Home Financials are based on the most recent Mortgage that was taken out on this home.
Original Mortgage
$85,600
Interest Rate
6.94%
Purchase Details
Closed on
Dec 1, 1994
Sold by
Christersen Stephen
Bought by
Christemen Sephen B
Purchase Details
Closed on
Nov 29, 1994
Sold by
Matlock Leslie
Bought by
Christersen Stephen
Purchase Details
Closed on
Nov 11, 1993
Bought by
Matlock Leslie Johnson
Purchase Details
Closed on
Aug 10, 1989
Bought by
C D R Development Inc
Create a Home Valuation Report for This Property
The Home Valuation Report is an in-depth analysis detailing your home's value as well as a comparison with similar homes in the area
Home Values in the Area
Average Home Value in this Area
Purchase History
| Date | Buyer | Sale Price | Title Company |
|---|---|---|---|
| Luke Edward D | -- | -- | |
| Luke Edward D | $107,000 | -- | |
| Christemen Sephen B | $84,900 | -- | |
| Christersen Stephen | $84,900 | -- | |
| Matlock Leslie Johnson | $12,000 | -- | |
| C D R Development Inc | -- | -- |
Source: Public Records
Mortgage History
| Date | Status | Borrower | Loan Amount |
|---|---|---|---|
| Previous Owner | C D R Development Inc | $85,600 |
Source: Public Records
Tax History Compared to Growth
Tax History
| Year | Tax Paid | Tax Assessment Tax Assessment Total Assessment is a certain percentage of the fair market value that is determined by local assessors to be the total taxable value of land and additions on the property. | Land | Improvement |
|---|---|---|---|---|
| 2024 | $1,839 | $106,225 | $16,400 | $89,825 |
| 2023 | $1,829 | $64,225 | $6,975 | $57,250 |
| 2022 | $1,729 | $64,225 | $6,975 | $57,250 |
| 2021 | $1,729 | $64,225 | $6,975 | $57,250 |
| 2020 | $1,729 | $64,225 | $6,975 | $57,250 |
| 2019 | $1,729 | $64,225 | $6,975 | $57,250 |
| 2018 | $1,752 | $55,825 | $6,275 | $49,550 |
| 2017 | $1,658 | $55,825 | $6,275 | $49,550 |
| 2016 | $1,577 | $55,825 | $6,275 | $49,550 |
| 2015 | $1,285 | $42,550 | $6,275 | $36,275 |
| 2014 | $1,285 | $42,550 | $6,275 | $36,275 |
Source: Public Records
Map
Nearby Homes
- 1001 Homestead Trail
- 0 Old Clarksville Pike Unit RTC3017253
- 1086 Jason Cir
- 6838 Old Clarksville Pike
- 1068 Carl Perry Rd
- 5511 Highway 41a
- 1061 N Fork Dr
- 0 W Side Rd Unit RTC2756551
- 1010 Cherokee Ct
- 0 Morgan Unit RTC2905012
- 0 Fox Dr Unit RTC2538178
- 0 Fox Dr Unit RTC2538177
- 0 Fox Dr Unit RTC2538176
- 0 Fox Dr Unit RTC2538175
- 0 Fox Dr Unit RTC2538174
- 0 Fox Dr Unit RTC2538173
- 0 Fox Dr Unit RTC2538172
- 0 Fox Dr Unit RTC2538171
- 0 Fox Dr Unit RTC2538170
- 0 Fox Dr Unit RTC2538169
- 1004 Forest Crossing
- 7200 Old Clarksville Pike
- 1007 Oakwood Rd
- 1011 Oakwood Rd
- 1003 Forest Crossing
- 1008 Forest Crossing
- 7218 Old Clarksville Pike
- 1015 Oakwood Rd
- 7139 Old Clarksville Pike
- 7142 Old Clarksville Pike
- 1014 Forest Crossing
- 1007 Forest Crossing
- 1002 Oakwood Rd
- 7224 Old Clarksville Pike
- 1023 Oakwood Rd
- 7131 Old Clarksville Pike
- 1012 Oakwood Rd
- 1007 Devon Place
- 1020 Forest Crossing
- 7229 Old Clarksville Pike