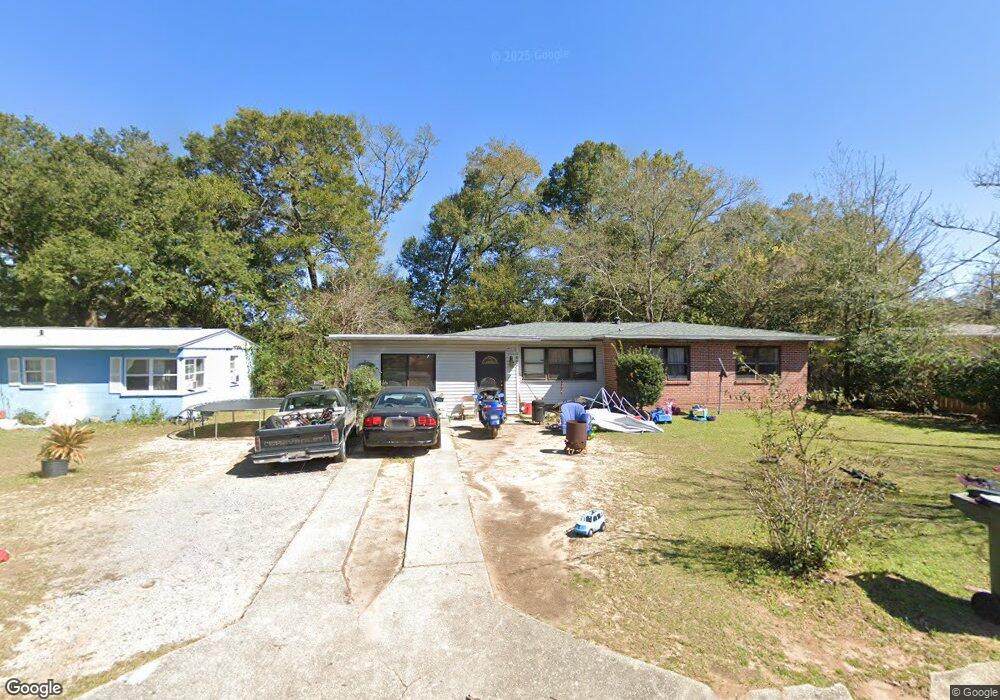
1002 Potomac Dr Pensacola, FL 32505
Estimated Value: $113,681 - $200,000
Studio
2
Baths
1,422
Sq Ft
$108/Sq Ft
Est. Value
About This Home
This home is located at 1002 Potomac Dr, Pensacola, FL 32505 and is currently estimated at $153,920, approximately $108 per square foot. 1002 Potomac Dr is a home located in Escambia County with nearby schools including Oakcrest Elementary School, Escambia High School, and Christian Institute of Arts & Science.
Ownership History
Date
Name
Owned For
Owner Type
Purchase Details
Closed on
Jul 28, 2017
Sold by
Devalcourt Olden J
Bought by
Fulfer Joey and Fulfer Rhonda
Current Estimated Value
Home Financials for this Owner
Home Financials are based on the most recent Mortgage that was taken out on this home.
Original Mortgage
$46,305
Outstanding Balance
$38,212
Interest Rate
3.91%
Mortgage Type
Purchase Money Mortgage
Estimated Equity
$115,708
Purchase Details
Closed on
May 18, 2009
Sold by
Ross Susan A and Ross Anthony
Bought by
Devalcourt Olden J
Purchase Details
Closed on
Nov 16, 2005
Sold by
Smith Ralph E and Smith Gretchen
Bought by
Ross Susan A
Home Financials for this Owner
Home Financials are based on the most recent Mortgage that was taken out on this home.
Original Mortgage
$76,500
Interest Rate
5.9%
Mortgage Type
Balloon
Purchase Details
Closed on
Nov 20, 1996
Sold by
Bancroft Melinda
Bought by
Bancroft James F
Create a Home Valuation Report for This Property
The Home Valuation Report is an in-depth analysis detailing your home's value as well as a comparison with similar homes in the area
Home Values in the Area
Average Home Value in this Area
Purchase History
| Date | Buyer | Sale Price | Title Company |
|---|---|---|---|
| Fulfer Joey | $45,000 | Partnership Title Co Llc | |
| Devalcourt Olden J | -- | None Available | |
| Ross Susan A | $61,000 | Southland Acquire Land Title | |
| Bancroft James F | $15,400 | -- |
Source: Public Records
Mortgage History
| Date | Status | Borrower | Loan Amount |
|---|---|---|---|
| Open | Fulfer Joey | $46,305 | |
| Previous Owner | Ross Susan A | $76,500 |
Source: Public Records
Tax History
| Year | Tax Paid | Tax Assessment Tax Assessment Total Assessment is a certain percentage of the fair market value that is determined by local assessors to be the total taxable value of land and additions on the property. | Land | Improvement |
|---|---|---|---|---|
| 2025 | $1,027 | $97,729 | $24,000 | $73,729 |
| 2024 | $1,000 | $95,044 | $20,000 | $75,044 |
| 2023 | $1,000 | $46,049 | $0 | $0 |
| 2022 | $840 | $65,034 | $8,000 | $57,034 |
| 2021 | $737 | $47,948 | $0 | $0 |
| 2020 | $643 | $35,118 | $0 | $0 |
| 2019 | $600 | $31,454 | $0 | $0 |
| 2018 | $580 | $29,563 | $0 | $0 |
| 2017 | $459 | $20,418 | $0 | $0 |
| 2016 | $553 | $26,726 | $0 | $0 |
| 2015 | $583 | $30,079 | $0 | $0 |
| 2014 | $594 | $31,370 | $0 | $0 |
Source: Public Records
Map
Nearby Homes
- 1011 Trenton Dr
- 823 S Madison Dr
- 1007 Kearny Dr
- 603 New York Dr
- 232 Broussard St
- 102 Tennessee Dr
- 10 Tennessee Dr
- 305 N Madison Dr
- 1165 Webster Dr
- 219 Mckinley Dr
- 2143 Waltham St
- 2187 Waltham St
- 229 Aquamarine Ave
- 2111 Waltham St
- 228 Topaz Ave
- 2238 Waltham St
- 117 Aquamarine Ave
- 4007 Embers Landing
- 107 W Madison Dr
- 3 Cherokee Trail
- 1004 Potomac Dr
- 428 Edison Dr
- 1001 Northview Dr
- 1003 Northview Dr
- 434 Edison Dr
- 1006 Potomac Dr
- 1005 Northview Dr
- 426 Edison Dr
- 1001 Potomac Dr
- 1008 Potomac Dr
- 1003 Potomac Dr
- 1007 Northview Dr
- 433 Edison Dr
- 431 Edison Dr
- 1005 Potomac Dr
- 429 Edison Dr
- 424 Edison Dr
- 437 Edison Dr
- 0 Edison Dr
- 1002 Northview Dr
Your Personal Tour Guide
Ask me questions while you tour the home.