Estimated Value: $852,967 - $1,174,000
3
Beds
2
Baths
1,044
Sq Ft
$953/Sq Ft
Est. Value
About This Home
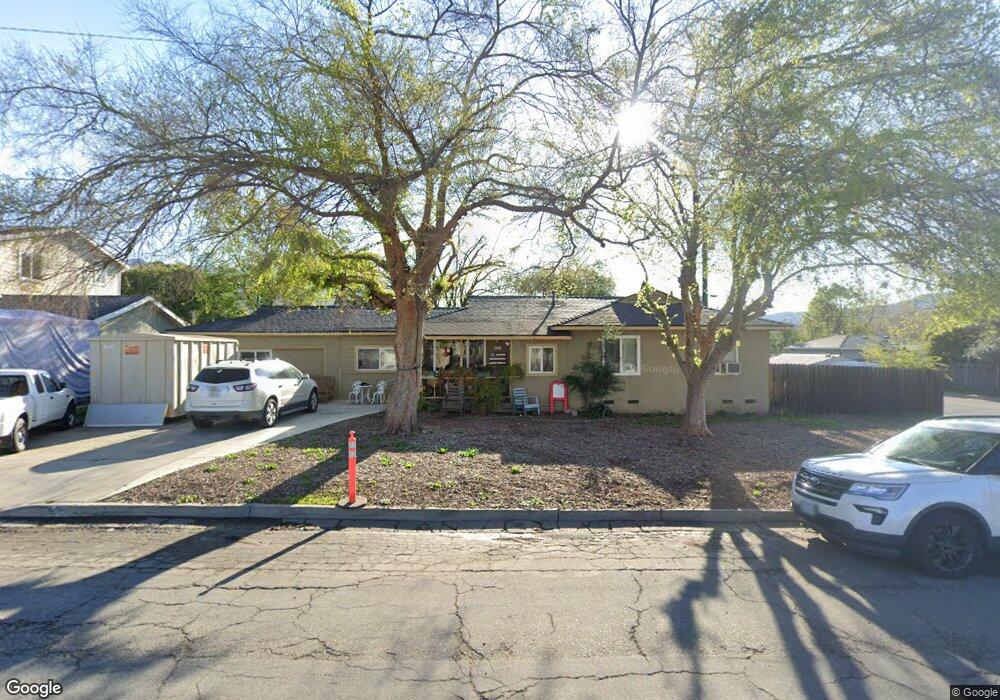
This home is located at 1002 Sunset Place, Ojai, CA 93023 and is currently estimated at $994,992, approximately $953 per square foot. 1002 Sunset Place is a home located in Ventura County with nearby schools including Topa Topa Elementary School, Matilija Junior High, and Legacy High School.
Ownership History
Date
Name
Owned For
Owner Type
Purchase Details
Closed on
Jul 2, 2018
Sold by
Granger Ruth A
Bought by
Granger Ruth A and Ruth A Granger Trust
Current Estimated Value
Purchase Details
Closed on
Mar 15, 2016
Sold by
Hurt Linda S
Bought by
Hurt James
Home Financials for this Owner
Home Financials are based on the most recent Mortgage that was taken out on this home.
Original Mortgage
$139,350
Interest Rate
3.72%
Mortgage Type
New Conventional
Purchase Details
Closed on
Mar 11, 2016
Sold by
Hurt James
Bought by
Hurt Shirley and Granger Ruth A
Home Financials for this Owner
Home Financials are based on the most recent Mortgage that was taken out on this home.
Original Mortgage
$139,350
Interest Rate
3.72%
Mortgage Type
New Conventional
Purchase Details
Closed on
Feb 12, 2015
Sold by
Hurt James
Bought by
Hurt James and Hurt Shirley
Purchase Details
Closed on
Sep 20, 2005
Sold by
Hurt Mildred L and Hurt Mildred Lee
Bought by
Hurt Mildred L
Create a Home Valuation Report for This Property
The Home Valuation Report is an in-depth analysis detailing your home's value as well as a comparison with similar homes in the area
Home Values in the Area
Average Home Value in this Area
Purchase History
| Date | Buyer | Sale Price | Title Company |
|---|---|---|---|
| Granger Ruth A | -- | None Available | |
| Hurt James | -- | First American Title Company | |
| Hurt Shirley | -- | First American Title Company | |
| Hurt James | -- | None Available | |
| Hurt Mildred L | -- | -- |
Source: Public Records
Mortgage History
| Date | Status | Borrower | Loan Amount |
|---|---|---|---|
| Closed | Hurt Shirley | $139,350 |
Source: Public Records
Tax History Compared to Growth
Tax History
| Year | Tax Paid | Tax Assessment Tax Assessment Total Assessment is a certain percentage of the fair market value that is determined by local assessors to be the total taxable value of land and additions on the property. | Land | Improvement |
|---|---|---|---|---|
| 2025 | $3,989 | $250,412 | $147,600 | $102,812 |
| 2024 | $3,989 | $245,502 | $144,705 | $100,797 |
| 2023 | $3,859 | $240,689 | $141,868 | $98,821 |
| 2022 | $3,825 | $235,970 | $139,086 | $96,884 |
| 2021 | $3,793 | $231,344 | $136,359 | $94,985 |
| 2020 | $3,707 | $228,974 | $134,962 | $94,012 |
| 2019 | $3,610 | $224,485 | $132,316 | $92,169 |
| 2018 | $3,566 | $220,084 | $129,722 | $90,362 |
| 2017 | $3,496 | $215,770 | $127,179 | $88,591 |
| 2016 | $1,487 | $54,797 | $16,522 | $38,275 |
| 2015 | $1,393 | $53,976 | $16,275 | $37,701 |
| 2014 | $1,272 | $52,920 | $15,957 | $36,963 |
Source: Public Records
Map
Nearby Homes
- 421 Andrew Dr
- 1222 Sunset Place
- 1201 Grand Ave
- 505 Park Rd
- 1519 Ayers Ave
- 601 Grand Ave
- 380 Shelf Rd
- 310 N Fulton St
- 216 N Fulton St
- 1209 San Ramon Way
- 1120 Sunnyglenn Ave
- 915 E Matilija St
- 1121 Sunnyglenn Ave
- 1214 Gregory St
- 1207 N Signal St
- 608 E Ojai Ave
- 0 E Ojai Ave Unit 224929
- 216 E Matilija St
- 1006 Sunset Place
- 1001 Grandview Ave
- 1005 Grandview Ave
- 1001 Sunset Place
- 918 Sunset Place
- 1005 Sunset Place
- 917 Grandview Ave
- 1010 Sunset Place
- 1009 Grandview Ave
- 917 Sunset Place
- 1009 Sunset Place
- 1002 Grandview Ave
- 914 Sunset Place
- 1006 Grandview Ave
- 913 Grandview Ave
- 809 Mountain View Ave
- 1014 Sunset Place
- 918 Grandview Ave
- 1013 Grandview Ave
- 804 Mountain View Ave