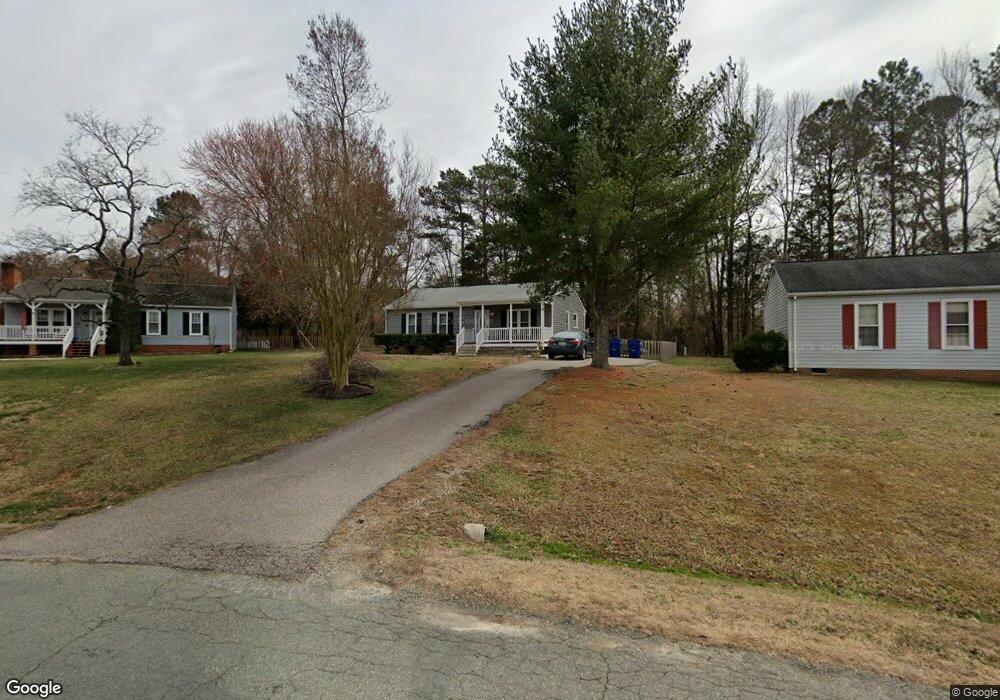
10025 E Alberta Ct Chesterfield, VA 23832
Estimated Value: $261,000 - $282,000
3
Beds
1
Bath
960
Sq Ft
$286/Sq Ft
Est. Value
About This Home
This home is located at 10025 E Alberta Ct, Chesterfield, VA 23832 and is currently estimated at $274,365, approximately $285 per square foot. 10025 E Alberta Ct is a home located in Chesterfield County with nearby schools including Thelma Crenshaw Elementary School, Bailey Bridge Middle School, and Manchester High.
Ownership History
Date
Name
Owned For
Owner Type
Purchase Details
Closed on
Jun 7, 2010
Sold by
Plancon Gordon A
Bought by
Rodriquez Jose E Berrios
Current Estimated Value
Home Financials for this Owner
Home Financials are based on the most recent Mortgage that was taken out on this home.
Original Mortgage
$127,147
Outstanding Balance
$86,376
Interest Rate
5.25%
Mortgage Type
FHA
Estimated Equity
$187,989
Purchase Details
Closed on
Jun 3, 2002
Sold by
Tye Jeffrey C
Bought by
Plancon Gordon A
Home Financials for this Owner
Home Financials are based on the most recent Mortgage that was taken out on this home.
Original Mortgage
$84,550
Interest Rate
7%
Mortgage Type
New Conventional
Purchase Details
Closed on
Jan 30, 1998
Sold by
Cox Starell M
Bought by
Tye Jeffrey C and Tye Wendy A
Home Financials for this Owner
Home Financials are based on the most recent Mortgage that was taken out on this home.
Original Mortgage
$68,986
Interest Rate
7.02%
Mortgage Type
New Conventional
Create a Home Valuation Report for This Property
The Home Valuation Report is an in-depth analysis detailing your home's value as well as a comparison with similar homes in the area
Home Values in the Area
Average Home Value in this Area
Purchase History
| Date | Buyer | Sale Price | Title Company |
|---|---|---|---|
| Rodriquez Jose E Berrios | $134,950 | -- | |
| Plancon Gordon A | $89,000 | -- | |
| Tye Jeffrey C | $68,500 | -- |
Source: Public Records
Mortgage History
| Date | Status | Borrower | Loan Amount |
|---|---|---|---|
| Open | Rodriquez Jose E Berrios | $127,147 | |
| Previous Owner | Tye Jeffrey C | $84,550 | |
| Previous Owner | Tye Jeffrey C | $68,986 |
Source: Public Records
Tax History
| Year | Tax Paid | Tax Assessment Tax Assessment Total Assessment is a certain percentage of the fair market value that is determined by local assessors to be the total taxable value of land and additions on the property. | Land | Improvement |
|---|---|---|---|---|
| 2025 | $2,116 | $234,900 | $60,000 | $174,900 |
| 2024 | $2,116 | $214,500 | $52,000 | $162,500 |
| 2023 | $1,866 | $205,100 | $49,000 | $156,100 |
| 2022 | $1,740 | $189,100 | $47,000 | $142,100 |
| 2021 | $1,667 | $168,500 | $45,000 | $123,500 |
| 2020 | $1,479 | $155,700 | $45,000 | $110,700 |
| 2019 | $1,419 | $149,400 | $42,000 | $107,400 |
| 2018 | $1,337 | $140,700 | $42,000 | $98,700 |
| 2017 | $1,261 | $131,400 | $42,000 | $89,400 |
| 2016 | $1,194 | $124,400 | $42,000 | $82,400 |
| 2015 | $1,146 | $116,800 | $42,000 | $74,800 |
| 2014 | $1,107 | $112,700 | $40,000 | $72,700 |
Source: Public Records
Map
Nearby Homes
- 5101 Blossomwood Cir
- 5407 Rollingway Rd
- 10723 Timberun Rd
- 5124 Rollingway Rd
- 11418 Parrish Creek Ln
- 10524 Sunne Ct
- 5107 Morning Dove Mews
- 5408 Qualla Trace Terrace
- 10383 Qualla Trace Dr
- 10370 Qualla Trace Dr
- 4519 Bexwood Dr
- 10339 Qualla Trace Dr
- 10350 Qualla Trace Dr
- 10333 Qualla Trace Dr
- 5419 Qualla Trace Ln
- 10332 Qualla Trace Dr
- Edison Plan at Qualla Trace - Smart Living
- Newton Plan at Qualla Trace - Smart Living
- Curie Plan at Qualla Trace - Smart Living
- King Plan at Qualla Trace - Smart Living
- 10031 E Alberta Ct
- 10019 E Alberta Ct
- 10013 E Alberta Ct
- 10037 E Alberta Ct
- 10020 E Alberta Ct
- 10007 E Alberta Ct
- 5110 Blossomwood Ct
- 10043 E Alberta Ct
- 5108 Blossomwood Ct
- 10036 E Alberta Ct
- 10042 E Alberta Ct
- 10006 E Alberta Ct
- 5106 Blossomwood Ct
- 5103 Alberta Rd
- 10001 E Alberta Ct
- 5112 Blossomwood Ct
- 10049 E Alberta Ct
- 5111 Alberta Rd
- 10000 E Alberta Ct
- 5104 Blossomwood Ct
Your Personal Tour Guide
Ask me questions while you tour the home.