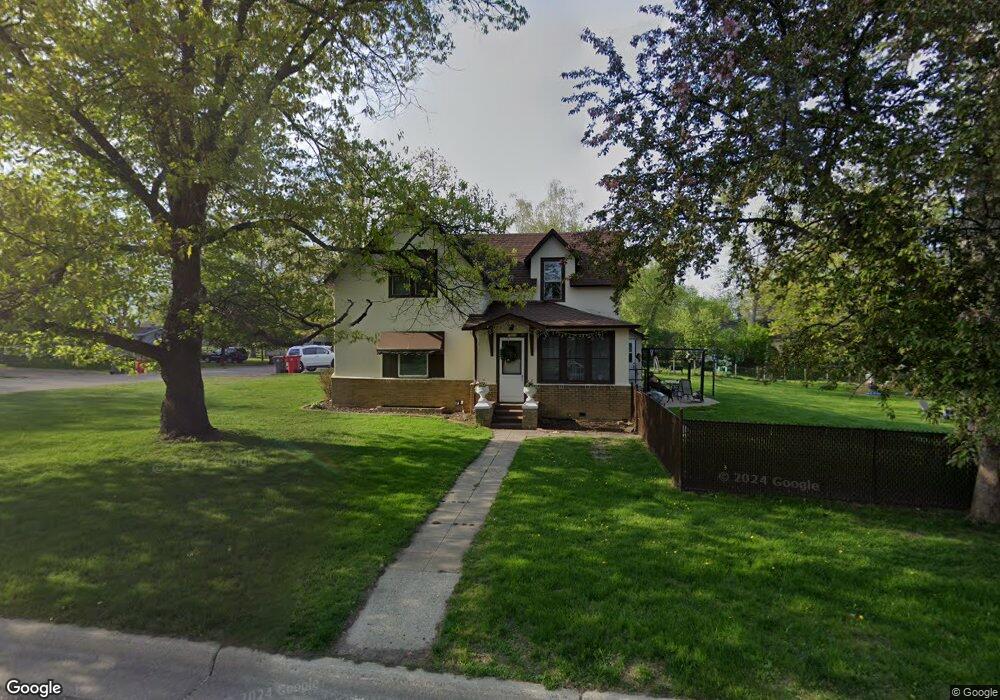
1003 1003 7th-Avenue-e Alexandria, MN 56308
Estimated Value: $216,000 - $260,000
4
Beds
3
Baths
1,022
Sq Ft
$231/Sq Ft
Est. Value
About This Home
This home is located at 1003 1003 7th-Avenue-e, Alexandria, MN 56308 and is currently estimated at $235,715, approximately $230 per square foot. 1003 1003 7th-Avenue-e is a home located in Douglas County with nearby schools including Woodland Elementary School, Discovery Middle School, and Alexandria Area High School.
Ownership History
Date
Name
Owned For
Owner Type
Purchase Details
Closed on
Mar 22, 2018
Sold by
Fenger Justin R and Fenger Katie
Bought by
Sorensen Nicole A and Sorensen Jeremy L
Current Estimated Value
Home Financials for this Owner
Home Financials are based on the most recent Mortgage that was taken out on this home.
Original Mortgage
$126,678
Outstanding Balance
$108,527
Interest Rate
4.37%
Mortgage Type
FHA
Estimated Equity
$127,188
Purchase Details
Closed on
Feb 10, 2017
Sold by
Burmeister Nathan A and Burmeister Julie
Bought by
Fenger Justin R and Fenger Katie
Purchase Details
Closed on
Jun 14, 2010
Sold by
Burmeister Nathan A and Johnson Kelly Jo
Bought by
Burmelster Nathan A
Purchase Details
Closed on
Feb 20, 2009
Sold by
Burmeister Nathan A
Bought by
Burmeister Nathan A and Johnson Kelly Jo
Purchase Details
Closed on
Apr 18, 2008
Sold by
Schulz Karen K
Bought by
Burmeister Nathan A
Home Financials for this Owner
Home Financials are based on the most recent Mortgage that was taken out on this home.
Original Mortgage
$135,900
Interest Rate
5.75%
Mortgage Type
FHA
Create a Home Valuation Report for This Property
The Home Valuation Report is an in-depth analysis detailing your home's value as well as a comparison with similar homes in the area
Home Values in the Area
Average Home Value in this Area
Purchase History
| Date | Buyer | Sale Price | Title Company |
|---|---|---|---|
| Sorensen Nicole A | $172,150 | Integrity Title | |
| Fenger Justin R | -- | None Available | |
| Burmelster Nathan A | -- | None Available | |
| Burmeister Nathan A | -- | Integrity Title Inc | |
| Burmeister Nathan A | $137,000 | None Available |
Source: Public Records
Mortgage History
| Date | Status | Borrower | Loan Amount |
|---|---|---|---|
| Open | Sorensen Nicole A | $126,678 | |
| Previous Owner | Burmeister Nathan A | $135,900 |
Source: Public Records
Tax History Compared to Growth
Tax History
| Year | Tax Paid | Tax Assessment Tax Assessment Total Assessment is a certain percentage of the fair market value that is determined by local assessors to be the total taxable value of land and additions on the property. | Land | Improvement |
|---|---|---|---|---|
| 2025 | $2,008 | $221,500 | $57,200 | $164,300 |
| 2024 | $2,008 | $213,200 | $54,500 | $158,700 |
| 2023 | $2,074 | $201,800 | $54,500 | $147,300 |
| 2022 | $1,942 | $183,600 | $51,100 | $132,500 |
| 2021 | $1,828 | $171,600 | $51,100 | $120,500 |
| 2020 | $1,790 | $160,700 | $51,100 | $109,600 |
| 2019 | $1,928 | $154,000 | $51,100 | $102,900 |
| 2018 | $1,526 | $147,700 | $51,100 | $96,600 |
| 2017 | $1,418 | $140,800 | $54,600 | $86,200 |
| 2016 | $1,350 | $131,629 | $53,253 | $78,376 |
| 2015 | $1,332 | $0 | $0 | $0 |
| 2014 | -- | $121,200 | $53,000 | $68,200 |
Source: Public Records
Map
Nearby Homes
- 1004 6th Ave E
- XXXX 7th Ave E
- 417 Park St
- 817 Maple St
- 604 7th Ave E
- 415 7th Ave E
- 1610 7th Ave E
- 116 N Quincy St
- 719 Jefferson St
- 401 Jefferson St
- 410 10th Ave E
- 206 N Nokomis St
- xxxx Nokomis St
- 1119 Kenwood St
- 301 8th Ave E
- 1415 Lake St Unit 105
- 1105 Jefferson St
- 1109 Lakeview Ave
- 1017 Hawthorne St
- 215 N Mckay Ave Unit 59