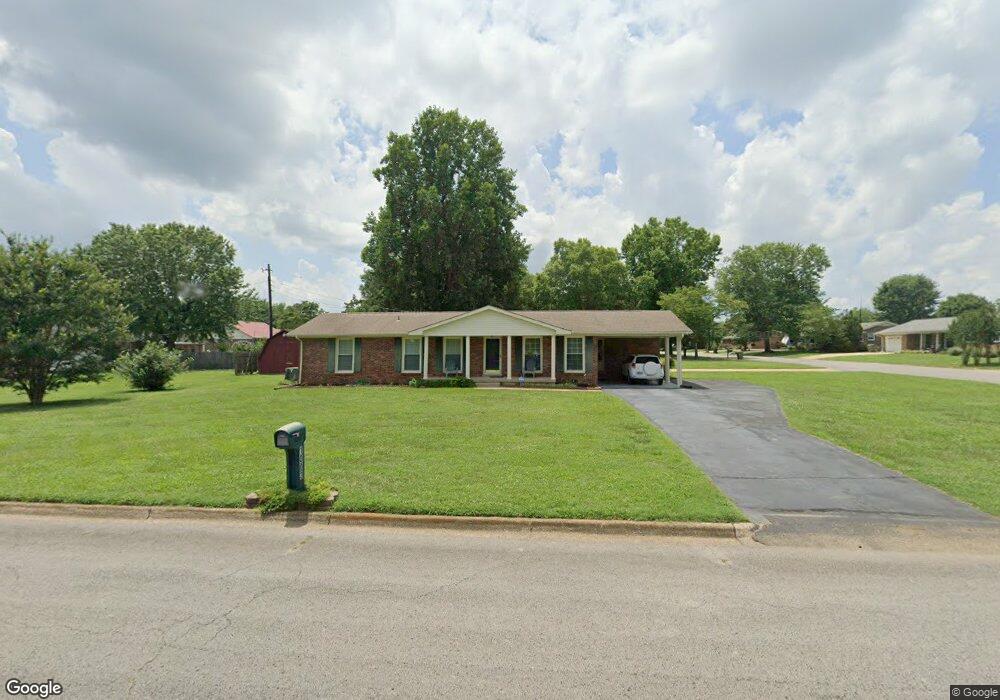
1003 5th Ave Lawrenceburg, TN 38464
Estimated Value: $205,495 - $278,000
--
Bed
2
Baths
1,542
Sq Ft
$163/Sq Ft
Est. Value
About This Home
This home is located at 1003 5th Ave, Lawrenceburg, TN 38464 and is currently estimated at $250,624, approximately $162 per square foot. 1003 5th Ave is a home located in Lawrence County with nearby schools including Ingram Sowell Elementary School, Lawrenceburg Public Elementary School, and David Crockett Elementary School.
Ownership History
Date
Name
Owned For
Owner Type
Purchase Details
Closed on
May 9, 2023
Sold by
Cain Ricky Howard
Bought by
Cain Ricky Howard and Cain Randy Nelson
Current Estimated Value
Purchase Details
Closed on
Sep 20, 2010
Sold by
Michael Doris Nell
Bought by
Michael Doris Nell
Home Financials for this Owner
Home Financials are based on the most recent Mortgage that was taken out on this home.
Original Mortgage
$86,400
Interest Rate
5.61%
Purchase Details
Closed on
Jun 22, 2010
Bought by
Cain Ricky Howard
Purchase Details
Closed on
Feb 9, 1995
Sold by
Beuerlein Lawrence E
Bought by
Michael Tonis
Purchase Details
Closed on
Apr 2, 1992
Bought by
Beuerlein Lawrence E
Purchase Details
Closed on
May 19, 1980
Bought by
Beuerlein Lawrence E and Beuerlein Wife
Purchase Details
Closed on
Jan 1, 1980
Create a Home Valuation Report for This Property
The Home Valuation Report is an in-depth analysis detailing your home's value as well as a comparison with similar homes in the area
Home Values in the Area
Average Home Value in this Area
Purchase History
| Date | Buyer | Sale Price | Title Company |
|---|---|---|---|
| Cain Ricky Howard | -- | None Listed On Document | |
| Michael Doris Nell | $86,400 | -- | |
| Cain Ricky Howard | $86,400 | -- | |
| Michael Tonis | $70,000 | -- | |
| Beuerlein Lawrence E | -- | -- | |
| Beuerlein Lawrence E | -- | -- | |
| -- | $38,000 | -- |
Source: Public Records
Mortgage History
| Date | Status | Borrower | Loan Amount |
|---|---|---|---|
| Previous Owner | Not Available | $86,400 |
Source: Public Records
Tax History Compared to Growth
Tax History
| Year | Tax Paid | Tax Assessment Tax Assessment Total Assessment is a certain percentage of the fair market value that is determined by local assessors to be the total taxable value of land and additions on the property. | Land | Improvement |
|---|---|---|---|---|
| 2025 | $1,258 | $40,475 | $0 | $0 |
| 2024 | $1,258 | $40,475 | $4,000 | $36,475 |
| 2023 | $1,258 | $40,475 | $4,000 | $36,475 |
| 2022 | $1,258 | $40,475 | $4,000 | $36,475 |
| 2021 | $1,086 | $24,700 | $2,750 | $21,950 |
| 2020 | $1,086 | $24,700 | $2,750 | $21,950 |
| 2019 | $1,086 | $24,700 | $2,750 | $21,950 |
| 2018 | $1,086 | $24,700 | $2,750 | $21,950 |
| 2017 | $1,086 | $24,700 | $2,750 | $21,950 |
| 2016 | $1,086 | $24,700 | $2,750 | $21,950 |
| 2015 | $1,028 | $24,700 | $2,750 | $21,950 |
| 2014 | $955 | $22,950 | $2,750 | $20,200 |
Source: Public Records
Map
Nearby Homes