Estimated Value: $177,000 - $256,718
4
Beds
2
Baths
1,872
Sq Ft
$114/Sq Ft
Est. Value
About This Home
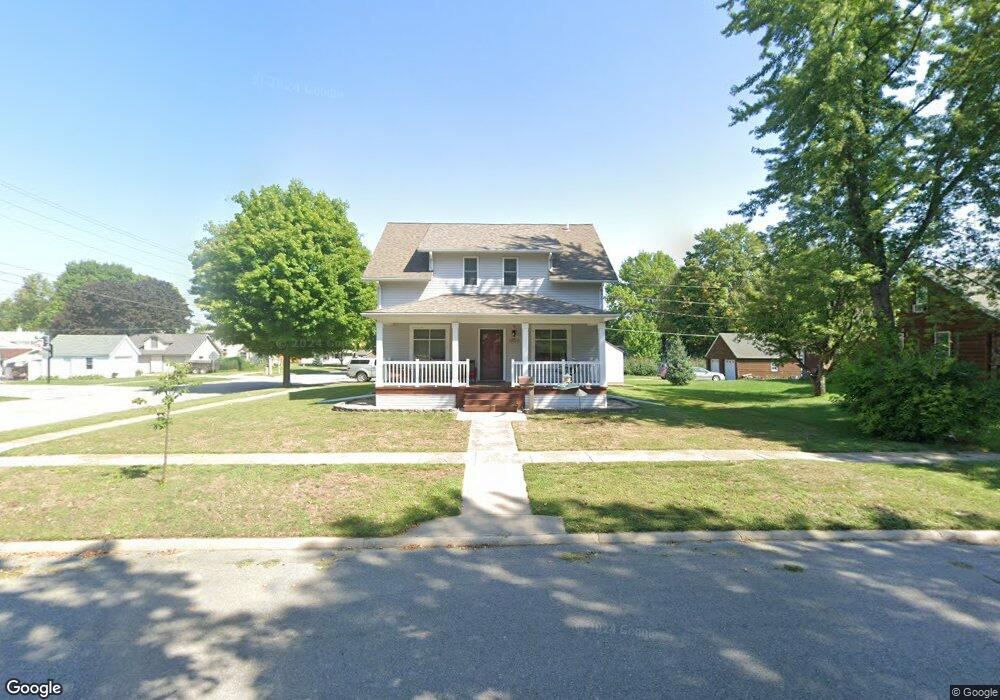
This home is located at 1003 Chase St, Osage, IA 50461 and is currently estimated at $213,430, approximately $114 per square foot. 1003 Chase St is a home located in Mitchell County with nearby schools including Lincoln Elementary School, Osage Middle School, and Osage High School.
Ownership History
Date
Name
Owned For
Owner Type
Purchase Details
Closed on
Oct 17, 2013
Sold by
Brown David L and Brown Kari L
Bought by
Bachman Michael D and Bachman Marie S
Current Estimated Value
Home Financials for this Owner
Home Financials are based on the most recent Mortgage that was taken out on this home.
Original Mortgage
$122,400
Outstanding Balance
$62,598
Interest Rate
4.59%
Mortgage Type
New Conventional
Estimated Equity
$150,832
Purchase Details
Closed on
Mar 25, 2010
Sold by
Scharper Cory and Scharper Joleen
Bought by
Brown David L and Brown Kari L
Home Financials for this Owner
Home Financials are based on the most recent Mortgage that was taken out on this home.
Original Mortgage
$81,225
Interest Rate
5%
Mortgage Type
New Conventional
Create a Home Valuation Report for This Property
The Home Valuation Report is an in-depth analysis detailing your home's value as well as a comparison with similar homes in the area
Home Values in the Area
Average Home Value in this Area
Purchase History
| Date | Buyer | Sale Price | Title Company |
|---|---|---|---|
| Bachman Michael D | $135,000 | None Available | |
| Brown David L | $85,500 | None Available |
Source: Public Records
Mortgage History
| Date | Status | Borrower | Loan Amount |
|---|---|---|---|
| Open | Bachman Michael D | $122,400 | |
| Previous Owner | Brown David L | $81,225 |
Source: Public Records
Tax History Compared to Growth
Tax History
| Year | Tax Paid | Tax Assessment Tax Assessment Total Assessment is a certain percentage of the fair market value that is determined by local assessors to be the total taxable value of land and additions on the property. | Land | Improvement |
|---|---|---|---|---|
| 2025 | $3,664 | $246,810 | $11,550 | $235,260 |
| 2024 | $3,664 | $230,670 | $11,550 | $219,120 |
| 2023 | $3,442 | $230,670 | $11,550 | $219,120 |
| 2022 | $3,034 | $174,800 | $11,550 | $163,250 |
| 2021 | $3,034 | $174,800 | $11,550 | $163,250 |
| 2020 | $2,514 | $153,370 | $11,550 | $141,820 |
Source: Public Records
Map
Nearby Homes