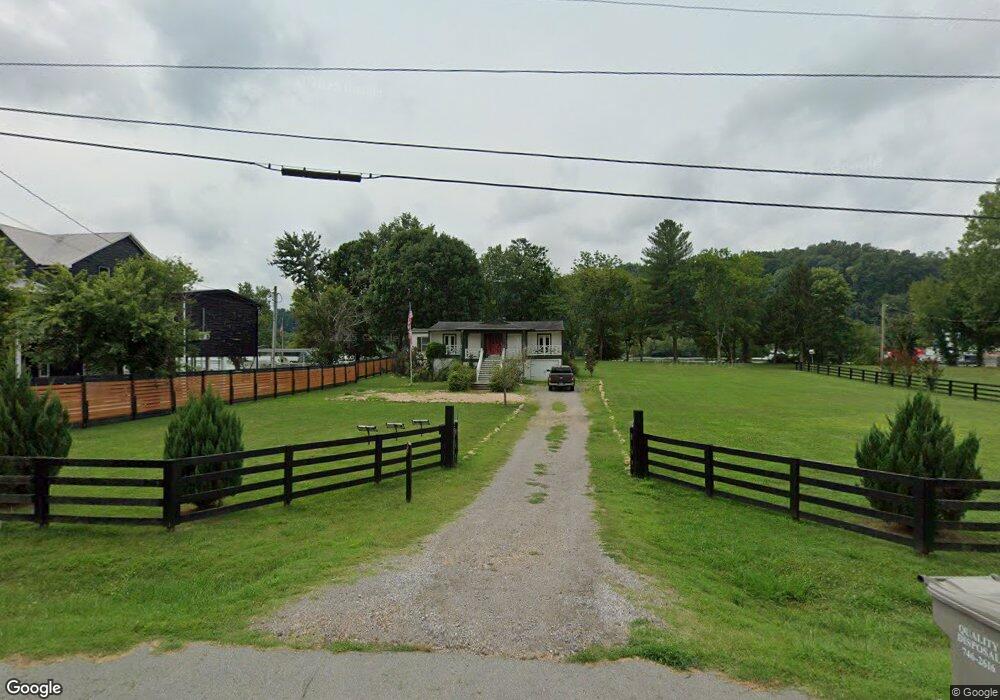
1003 Cumberland Dr Chapmansboro, TN 37035
Chapmansboro NeighborhoodEstimated Value: $425,837 - $513,000
2
Beds
3
Baths
1,850
Sq Ft
$261/Sq Ft
Est. Value
About This Home
This home is located at 1003 Cumberland Dr, Chapmansboro, TN 37035 and is currently estimated at $482,459, approximately $260 per square foot. 1003 Cumberland Dr is a home located in Cheatham County with nearby schools including Ashland City Elementary School, Cheatham Middle School, and Cheatham County Central High School.
Ownership History
Date
Name
Owned For
Owner Type
Purchase Details
Closed on
Aug 8, 2018
Sold by
Edwards William M
Bought by
Kappy Christopher T
Current Estimated Value
Home Financials for this Owner
Home Financials are based on the most recent Mortgage that was taken out on this home.
Original Mortgage
$450,000
Interest Rate
4.5%
Mortgage Type
Purchase Money Mortgage
Purchase Details
Closed on
Aug 2, 2018
Sold by
Orman Lisa Gail and Orman Jerry
Bought by
Edwards Willam M
Home Financials for this Owner
Home Financials are based on the most recent Mortgage that was taken out on this home.
Original Mortgage
$450,000
Interest Rate
4.5%
Mortgage Type
Purchase Money Mortgage
Purchase Details
Closed on
Jul 7, 2014
Sold by
Kimbro Susan E
Bought by
Edwards William M
Purchase Details
Closed on
Jul 1, 2010
Sold by
Orman Jerry
Bought by
Kimbro Susan E
Purchase Details
Closed on
Sep 19, 1985
Bought by
Orman Dennis
Purchase Details
Closed on
Jan 1, 1982
Create a Home Valuation Report for This Property
The Home Valuation Report is an in-depth analysis detailing your home's value as well as a comparison with similar homes in the area
Home Values in the Area
Average Home Value in this Area
Purchase History
| Date | Buyer | Sale Price | Title Company |
|---|---|---|---|
| Kappy Christopher T | $500,000 | None Available | |
| Edwards Willam M | -- | None Available | |
| Edwards William M | $175,000 | -- | |
| Kimbro Susan E | $100,000 | -- | |
| Orman Dennis | -- | -- | |
| -- | $20,000 | -- |
Source: Public Records
Mortgage History
| Date | Status | Borrower | Loan Amount |
|---|---|---|---|
| Closed | Kappy Christopher T | $450,000 |
Source: Public Records
Tax History Compared to Growth
Tax History
| Year | Tax Paid | Tax Assessment Tax Assessment Total Assessment is a certain percentage of the fair market value that is determined by local assessors to be the total taxable value of land and additions on the property. | Land | Improvement |
|---|---|---|---|---|
| 2025 | $1,642 | $94,875 | $0 | $0 |
| 2024 | $1,642 | $94,875 | $22,875 | $72,000 |
| 2023 | $1,707 | $59,925 | $9,450 | $50,475 |
| 2022 | $1,631 | $59,925 | $9,450 | $50,475 |
| 2021 | $1,631 | $59,925 | $9,450 | $50,475 |
| 2020 | $1,661 | $59,925 | $9,450 | $50,475 |
| 2019 | $1,613 | $59,925 | $9,450 | $50,475 |
| 2018 | $1,428 | $45,250 | $9,000 | $36,250 |
| 2017 | $1,351 | $45,250 | $9,000 | $36,250 |
| 2016 | $1,286 | $45,250 | $9,000 | $36,250 |
| 2015 | $1,231 | $40,625 | $9,000 | $31,625 |
| 2014 | $361 | $11,925 | $9,000 | $2,925 |
Source: Public Records
Map
Nearby Homes
- 1001 Cumberland Dr
- Lot 5 Matlock Dr
- 1341 Chapmansboro Rd
- 392 Feather Ridge Rd
- 3257 Ashland City Hwy
- 0 Hwy 49 W
- 432 Slow Roll Dr
- 501 Chapmansboro Rd
- 0 Hwy 49 E Unit RTC2641595
- 1 Highway 12 N
- 4 Highway 12 N
- 0 Bobbitt Rd
- 702 Cherrywood Ct
- 0 Aresti Dr
- 2055 Petway Rd
- 2789 Highway 12 N
- 1084 Ben Collier Rd
- 1719 Wynnewood Dr
- 2130 Petway Rd
- 1032 Lockridge Ln
- 1005 Cumberland Dr
- 1011 Cumberland Dr
- 1006 Cumberland Dr
- 1002 Cumberland Dr
- 1601 Matlock Dr
- 1017 Cumberland Dr
- 1024 Cumberland Dr
- 1567 Matlock Dr
- 1569 Matlock Dr
- 1555 Matlock Dr
- 1554 Matlock Dr
- 1019 Cumberland Dr
- 1545 Matlock Dr
- 1541 Matlock Dr
- 1537 Matlock Dr
- 1537 Matlock Dr
- 1534 Matlock Dr
- 1535 Matlock Dr
- 1531 Matlock Dr
- 1529 Matlock Dr