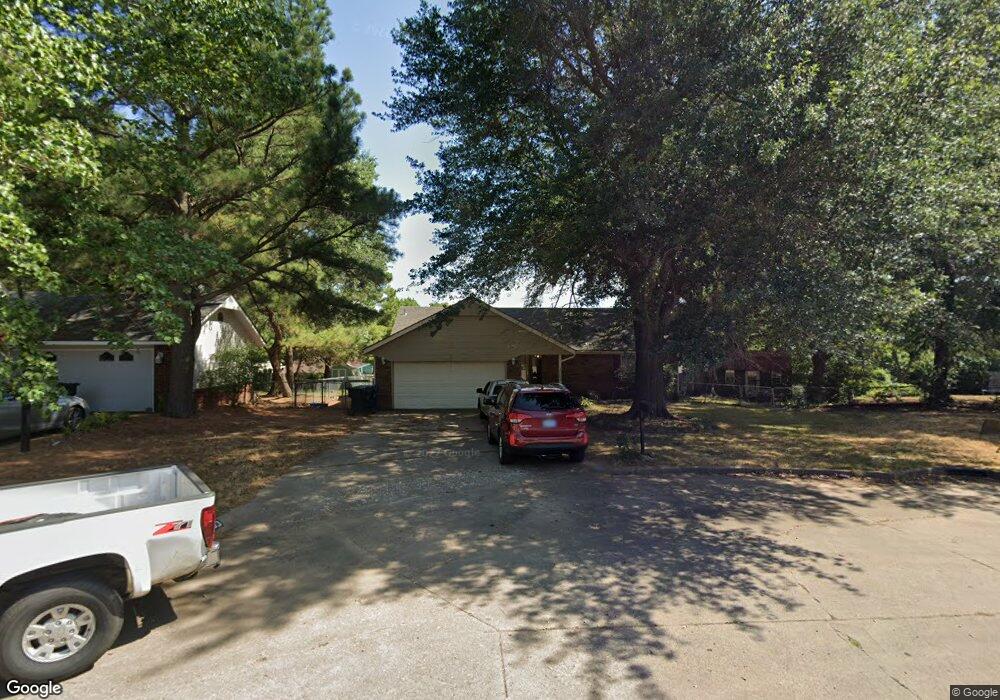
1003 E Comet Place Claremore, OK 74017
Estimated Value: $204,685 - $239,000
3
Beds
2
Baths
1,506
Sq Ft
$150/Sq Ft
Est. Value
About This Home
This home is located at 1003 E Comet Place, Claremore, OK 74017 and is currently estimated at $225,421, approximately $149 per square foot. 1003 E Comet Place is a home located in Rogers County with nearby schools including Roosa Elementary School, Will Rogers Junior High School, and Claremore High School.
Ownership History
Date
Name
Owned For
Owner Type
Purchase Details
Closed on
Sep 8, 2017
Sold by
Knight Jennifer Denise
Bought by
Lairmore Brenda Sue
Current Estimated Value
Home Financials for this Owner
Home Financials are based on the most recent Mortgage that was taken out on this home.
Original Mortgage
$143,186
Outstanding Balance
$119,381
Interest Rate
3.93%
Mortgage Type
Purchase Money Mortgage
Estimated Equity
$106,040
Purchase Details
Closed on
Sep 30, 2010
Sold by
Ferrel Matthew S
Bought by
Lairmore Brenda Sue
Purchase Details
Closed on
Mar 17, 2006
Sold by
Kelley Tom and Kelley Wilma
Bought by
Ferrel Matthew S and Ferrel Abby H
Home Financials for this Owner
Home Financials are based on the most recent Mortgage that was taken out on this home.
Original Mortgage
$110,675
Interest Rate
6.19%
Mortgage Type
New Conventional
Purchase Details
Closed on
Dec 23, 1992
Sold by
Goodwin Phillip K
Purchase Details
Closed on
Jun 30, 1992
Sold by
Cumbee Jack E
Create a Home Valuation Report for This Property
The Home Valuation Report is an in-depth analysis detailing your home's value as well as a comparison with similar homes in the area
Home Values in the Area
Average Home Value in this Area
Purchase History
| Date | Buyer | Sale Price | Title Company |
|---|---|---|---|
| Lairmore Brenda Sue | $125,000 | Rogers County Abstract Co | |
| Lairmore Brenda Sue | $126,000 | -- | |
| Ferrel Matthew S | $116,500 | Anchor Title & Closing | |
| -- | -- | -- | |
| -- | $73,000 | -- |
Source: Public Records
Mortgage History
| Date | Status | Borrower | Loan Amount |
|---|---|---|---|
| Open | Lairmore Brenda Sue | $143,186 | |
| Previous Owner | Ferrel Matthew S | $110,675 |
Source: Public Records
Tax History
| Year | Tax Paid | Tax Assessment Tax Assessment Total Assessment is a certain percentage of the fair market value that is determined by local assessors to be the total taxable value of land and additions on the property. | Land | Improvement |
|---|---|---|---|---|
| 2025 | $1,361 | $16,728 | $5,575 | $11,153 |
| 2024 | $1,361 | $16,727 | $3,961 | $12,766 |
| 2023 | $1,361 | $16,240 | $3,082 | $13,158 |
| 2022 | $1,367 | $15,767 | $2,200 | $13,567 |
| 2021 | $1,335 | $16,120 | $2,200 | $13,920 |
| 2020 | $1,344 | $16,022 | $2,200 | $13,822 |
| 2019 | $1,317 | $15,224 | $2,200 | $13,024 |
| 2018 | $1,349 | $15,794 | $2,200 | $13,594 |
| 2017 | $1,299 | $15,147 | $2,200 | $12,947 |
| 2016 | $1,286 | $14,706 | $2,200 | $12,506 |
| 2015 | $1,231 | $14,278 | $2,200 | $12,078 |
| 2014 | $1,193 | $13,862 | $2,200 | $11,662 |
Source: Public Records
Map
Nearby Homes
- 814 E Comet St
- 1137 N Oklahoma Ave
- 1007 N Faulkner Place
- 1008 N Sioux Ave
- 1114 N Osage Ave
- 821 E 11th St
- 817 E 11th St
- 1402 N Dorothy Ave
- 1317 N Mcfarland Place
- 326 E 15th St
- 1335 N Mcfarland Place
- 1411 N Choctaw Place
- 1929 Lexington Rd
- 221 N Dorothy Ave
- 520 E 6th St
- 614 E 5th St
- 212 N Lavira Ave
- 403 N Choctaw Ave
- 401 W Blue Starr Dr
- 104 W 7th St
- 1005 E Comet Place
- 1001 E Comet Place
- 1002 E 13th St
- 946 E 13th St
- 1007 E Comet Place
- 1004 E 13th St
- 1002 E Comet Place
- 1006 E Comet Place
- 1004 E Comet Place
- 944 E 13th St
- 1009 E Comet Place
- 1008 E Comet Place
- 1006 E 13th St
- 1001 E 13th St
- 1202 Parkland Ave
- 1204 Parkland Ave
- 942 E 13th St
- 1003 E 13th St
- 1010 E Comet Place
- 1011 E Comet Place
Your Personal Tour Guide
Ask me questions while you tour the home.