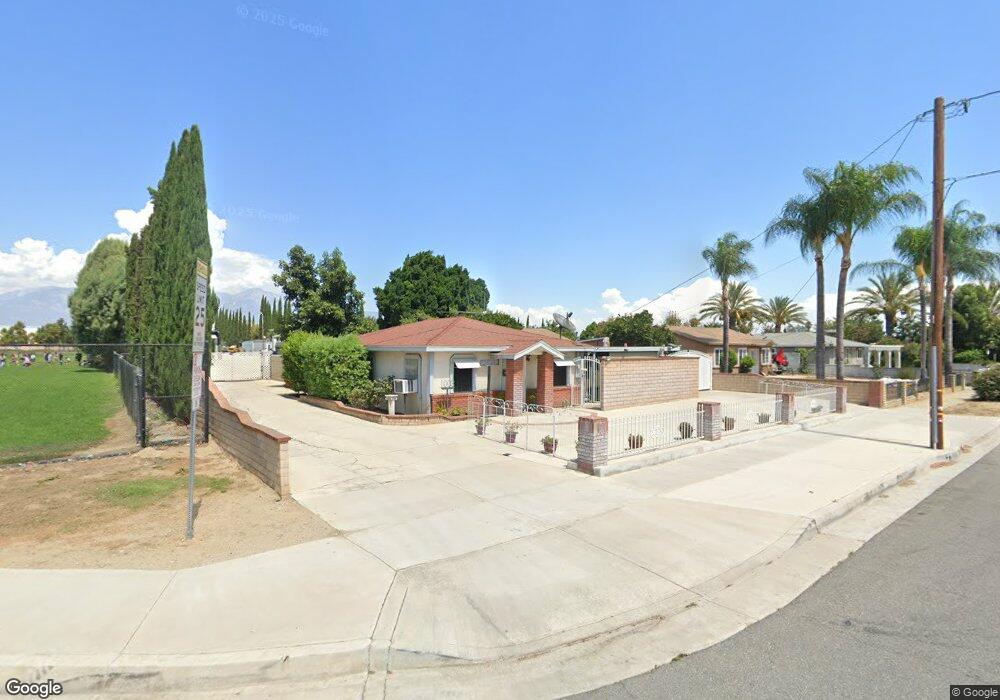
1003 E Philadelphia St Ontario, CA 91761
Downtown Ontario NeighborhoodEstimated Value: $428,000 - $722,067
2
Beds
1
Bath
768
Sq Ft
$805/Sq Ft
Est. Value
About This Home
This home is located at 1003 E Philadelphia St, Ontario, CA 91761 and is currently estimated at $618,267, approximately $805 per square foot. 1003 E Philadelphia St is a home located in San Bernardino County with nearby schools including Bon View Elementary, De Anza Middle, and Ontario High School.
Ownership History
Date
Name
Owned For
Owner Type
Purchase Details
Closed on
Nov 6, 2006
Sold by
Anderson Val
Bought by
Anderson Jon Scott
Current Estimated Value
Purchase Details
Closed on
Jun 26, 2003
Sold by
Anderson Val
Bought by
Anderson Jon Scott and Anderson Val
Purchase Details
Closed on
Mar 28, 1996
Sold by
Anderson Van and Anderson Tamra Pauline
Bought by
Anderson Val and Val R Anderson Living Trust
Create a Home Valuation Report for This Property
The Home Valuation Report is an in-depth analysis detailing your home's value as well as a comparison with similar homes in the area
Home Values in the Area
Average Home Value in this Area
Purchase History
| Date | Buyer | Sale Price | Title Company |
|---|---|---|---|
| Anderson Jon Scott | -- | None Available | |
| Anderson Jon Scott | -- | -- | |
| Anderson Val | -- | -- |
Source: Public Records
Tax History Compared to Growth
Tax History
| Year | Tax Paid | Tax Assessment Tax Assessment Total Assessment is a certain percentage of the fair market value that is determined by local assessors to be the total taxable value of land and additions on the property. | Land | Improvement |
|---|---|---|---|---|
| 2025 | $1,687 | $162,508 | $152,349 | $10,159 |
| 2024 | $1,687 | $159,322 | $149,362 | $9,960 |
| 2023 | $1,638 | $156,198 | $146,433 | $9,765 |
| 2022 | $1,615 | $153,136 | $143,562 | $9,574 |
| 2021 | $1,603 | $150,133 | $140,747 | $9,386 |
| 2020 | $1,574 | $148,594 | $139,304 | $9,290 |
| 2019 | $1,560 | $145,681 | $136,573 | $9,108 |
| 2018 | $1,536 | $142,824 | $133,895 | $8,929 |
| 2017 | $1,480 | $140,024 | $131,270 | $8,754 |
| 2016 | $1,421 | $137,278 | $128,696 | $8,582 |
| 2015 | $1,410 | $135,216 | $126,763 | $8,453 |
| 2014 | $1,365 | $132,567 | $124,280 | $8,287 |
Source: Public Records
Map
Nearby Homes
- 4235 S Gasly Paseo
- 0 Vineyard Unit CV25067044
- 4245 S Grasly Paseo
- 4233 S Grasly Paseo
- 0 Phillips Unit CV23180894
- 840 E Cedar St
- 2437 S Garfield Place
- 2030 S Bon View Ave Unit G
- 2119 S Phoenix Place
- 2408 S Taylor Place
- 2001 S Campus Ave Unit 7F
- 2453 S Marigold Place
- 1020 E Tam o Shanter Ct
- 2148 S Sultana Ave
- 2300 S Sultana Ave Unit 298
- 513 E Fairfield Ct
- 1456 E Philadelphia St Unit 134
- 1456 E Philadelphia St Unit 378
- 1456 E Philadelphia St
- 1456 E Philadelphia St Unit 279
- 1011 E Philadelphia St
- 1019 E Philadelphia St
- 2202 S Greenwood Place Unit B6
- 2202 S Greenwood Place Unit A
- 2202 S Greenwood Place Unit B
- 2208 S Greenwood Place Unit A
- 2208 S Greenwood Place Unit B
- 2208 S Greenwood Place Unit C
- 2201 S Greenwood Place Unit D
- 2201 S Greenwood Place Unit C
- 2201 S Greenwood Place Unit B
- 2201 S Greenwood Place Unit A
- 2214 S Greenwood Place Unit A
- 2214 S Greenwood Place Unit B
- 943 E Sanderling St
- 2220 S Greenwood Place Unit D
- 2220 S Greenwood Place Unit C
- 2220 S Greenwood Place Unit B
- 2220 S Greenwood Place Unit A
- 937 E Sanderling St