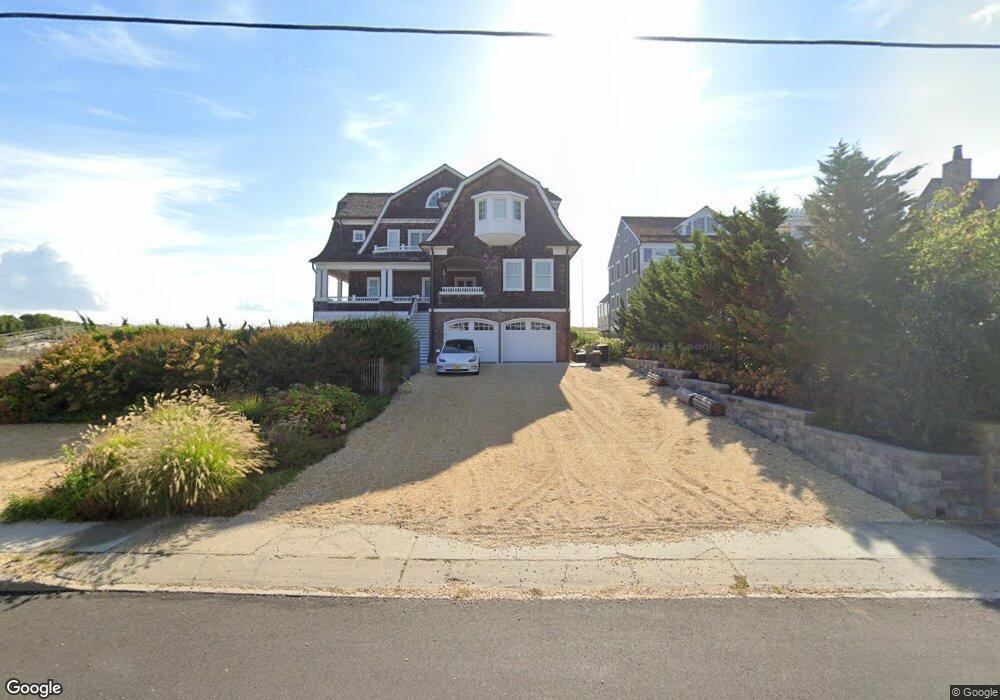
1003 East Ave Mantoloking, NJ 08738
Estimated Value: $5,831,000 - $8,850,000
7
Beds
9
Baths
5,342
Sq Ft
$1,466/Sq Ft
Est. Value
About This Home
This home is located at 1003 East Ave, Mantoloking, NJ 08738 and is currently estimated at $7,830,585, approximately $1,465 per square foot. 1003 East Ave is a home located in Ocean County with nearby schools including G Harold Antrim Elementary School, Point Pleasant Beach High School, and St. Peter School.
Ownership History
Date
Name
Owned For
Owner Type
Purchase Details
Closed on
May 19, 2014
Sold by
Burke Stephen E
Bought by
Bay Head Montoloking Land Co
Current Estimated Value
Purchase Details
Closed on
Apr 26, 2014
Sold by
Stephenson Barbara
Bought by
Burke Stephen E
Purchase Details
Closed on
Mar 15, 2006
Sold by
Seth Subash C and Seth Paulette
Bought by
Gmelich Justin and Gmelich Victoria
Purchase Details
Closed on
May 2, 1997
Sold by
Newman E O Margaret
Bought by
Subash Seth and Seth Paulette
Home Financials for this Owner
Home Financials are based on the most recent Mortgage that was taken out on this home.
Original Mortgage
$500,000
Interest Rate
7.88%
Create a Home Valuation Report for This Property
The Home Valuation Report is an in-depth analysis detailing your home's value as well as a comparison with similar homes in the area
Home Values in the Area
Average Home Value in this Area
Purchase History
| Date | Buyer | Sale Price | Title Company |
|---|---|---|---|
| Bay Head Montoloking Land Co | -- | None Available | |
| Burke Stephen E | -- | None Available | |
| Gmelich Justin | $5,250,000 | None Available | |
| Subash Seth | $1,025,000 | -- |
Source: Public Records
Mortgage History
| Date | Status | Borrower | Loan Amount |
|---|---|---|---|
| Previous Owner | Subash Seth | $500,000 |
Source: Public Records
Tax History Compared to Growth
Tax History
| Year | Tax Paid | Tax Assessment Tax Assessment Total Assessment is a certain percentage of the fair market value that is determined by local assessors to be the total taxable value of land and additions on the property. | Land | Improvement |
|---|---|---|---|---|
| 2025 | $50,619 | $5,899,700 | $2,730,000 | $3,169,700 |
| 2024 | $48,102 | $5,899,700 | $2,730,000 | $3,169,700 |
| 2023 | $41,272 | $5,894,900 | $2,730,000 | $3,164,900 |
| 2022 | $41,272 | $5,896,000 | $2,730,000 | $3,166,000 |
| 2021 | $41,508 | $5,896,000 | $2,730,000 | $3,166,000 |
| 2020 | $41,980 | $5,896,000 | $2,730,000 | $3,166,000 |
| 2019 | $41,390 | $5,896,000 | $2,730,000 | $3,166,000 |
| 2018 | $40,800 | $5,896,000 | $2,730,000 | $3,166,000 |
| 2017 | $41,095 | $5,896,000 | $2,730,000 | $3,166,000 |
| 2016 | $40,918 | $5,896,000 | $2,730,000 | $3,166,000 |
| 2015 | $40,270 | $2,730,000 | $2,730,000 | $0 |
| 2014 | $20,784 | $3,314,900 | $2,730,000 | $584,900 |
Source: Public Records
Map
Nearby Homes