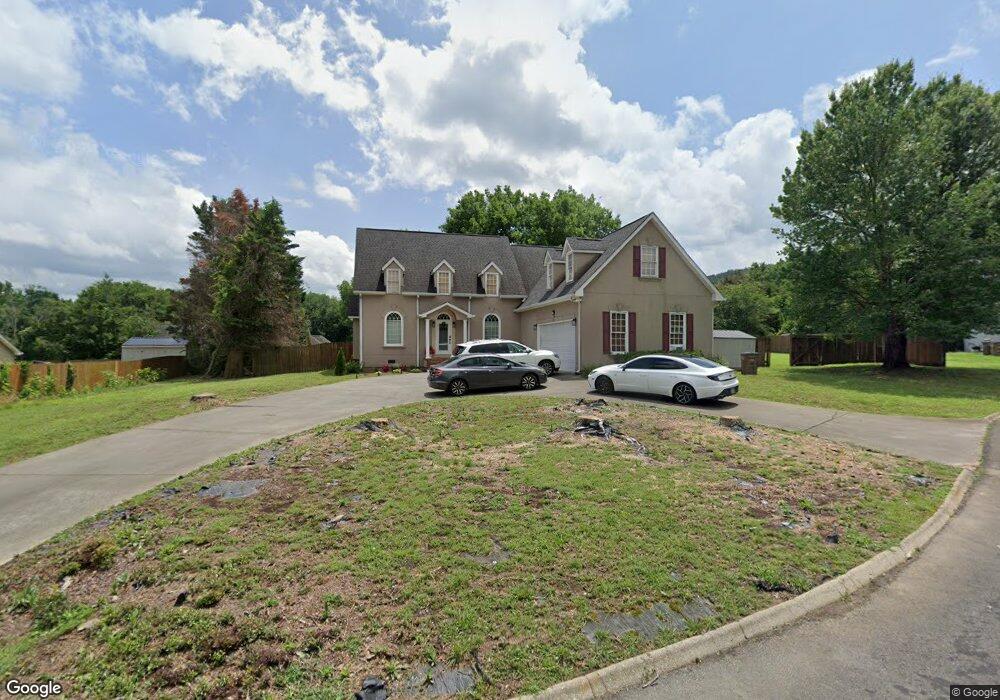
1003 Fieldgreen Ct Dalton, GA 30720
Estimated Value: $391,796 - $465,000
--
Bed
3
Baths
2,869
Sq Ft
$148/Sq Ft
Est. Value
About This Home
This home is located at 1003 Fieldgreen Ct, Dalton, GA 30720 and is currently estimated at $423,949, approximately $147 per square foot. 1003 Fieldgreen Ct is a home located in Whitfield County with nearby schools including Dug Gap Elementary School, Valley Point Middle School, and Southeast Whitfield County High School.
Ownership History
Date
Name
Owned For
Owner Type
Purchase Details
Closed on
May 30, 2023
Sold by
Palacios Francisco Miguel
Bought by
Sajwani Sarah T
Current Estimated Value
Home Financials for this Owner
Home Financials are based on the most recent Mortgage that was taken out on this home.
Original Mortgage
$351,500
Outstanding Balance
$342,101
Interest Rate
6.39%
Mortgage Type
New Conventional
Estimated Equity
$81,848
Purchase Details
Closed on
Mar 24, 2005
Sold by
Not Provided
Bought by
Palacios Francisco M
Purchase Details
Closed on
Nov 1, 2001
Sold by
Jarvis Cheri J
Bought by
Palacios Francisco M and Palacios Ivette R
Purchase Details
Closed on
Jan 7, 2000
Sold by
G E Capital Mortgage
Bought by
Jarvis Cheri J
Purchase Details
Closed on
Jan 1, 1999
Bought by
G E Capital Mortgage
Create a Home Valuation Report for This Property
The Home Valuation Report is an in-depth analysis detailing your home's value as well as a comparison with similar homes in the area
Home Values in the Area
Average Home Value in this Area
Purchase History
| Date | Buyer | Sale Price | Title Company |
|---|---|---|---|
| Sajwani Sarah T | $370,000 | None Listed On Document | |
| Palacios Francisco M | -- | -- | |
| Palacios Francisco M | $195,000 | -- | |
| Jarvis Cheri J | $178,000 | -- | |
| G E Capital Mortgage | -- | -- |
Source: Public Records
Mortgage History
| Date | Status | Borrower | Loan Amount |
|---|---|---|---|
| Open | Sajwani Sarah T | $351,500 |
Source: Public Records
Tax History Compared to Growth
Tax History
| Year | Tax Paid | Tax Assessment Tax Assessment Total Assessment is a certain percentage of the fair market value that is determined by local assessors to be the total taxable value of land and additions on the property. | Land | Improvement |
|---|---|---|---|---|
| 2024 | $3,628 | $153,119 | $14,800 | $138,319 |
| 2023 | $3,628 | $134,960 | $10,000 | $124,960 |
| 2022 | $2,507 | $93,550 | $10,000 | $83,550 |
| 2021 | $2,682 | $99,448 | $10,000 | $89,448 |
| 2020 | $2,761 | $99,448 | $10,000 | $89,448 |
| 2019 | $3,035 | $107,010 | $10,000 | $97,010 |
| 2018 | $3,079 | $107,010 | $10,000 | $97,010 |
| 2017 | $3,080 | $107,010 | $10,000 | $97,010 |
| 2016 | $2,873 | $103,620 | $9,213 | $94,407 |
| 2014 | $2,408 | $96,841 | $8,610 | $88,231 |
| 2013 | -- | $96,841 | $8,610 | $88,231 |
Source: Public Records
Map
Nearby Homes
- 2001 Eagle Point Dr
- 104 Buckingham Dr
- 1909 Sourwood Dr
- 2512 Dug Gap Rd
- 0 Shannon Dr Unit 131263
- 428 Lower Dug Gap Rd SW
- 608 Brookview Ln
- 604 Foster Rd
- 0 Fawn Dr Unit 130141
- 0 Fawn Dr Unit 130140
- 1908 Valley Brook Dr
- 0 Taylor Dr Unit 130142
- 0 Taylor Dr Unit 130143
- 702 Courtland Dr
- 0 Vinewood Dr
- 1922 W Brookhaven Cir
- 1922 W Brookhaven Cir
- 1915 W Brookhaven Cir
- 3016 E Brookhaven Cir
- 408 Alex Dr
- 1005 Fieldgreen Ct
- 1104 Field Green Ct
- 1105 Field Green Ct
- 1105 Fieldgreen Ct
- 1001 Fieldgreen Ct
- 1136 Glen Cove Dr
- 1128 Glen Cove Dr
- 1002 Fieldgreen Ct
- 1004 Fieldgreen Ct
- 1000 Fieldgreen Ct
- 1138 Glen Cove Dr
- 1127 Glen Cove Dr
- 1125 Glen Cove Dr
- 1129 Glen Cove Dr
- 214 Oliver Way
- 1135 Glen Cove Dr
- 1122 Glen Cove Dr
- 1115 Glen Cove Dr
- 170 Oliver Way
- 170 Oliver Way