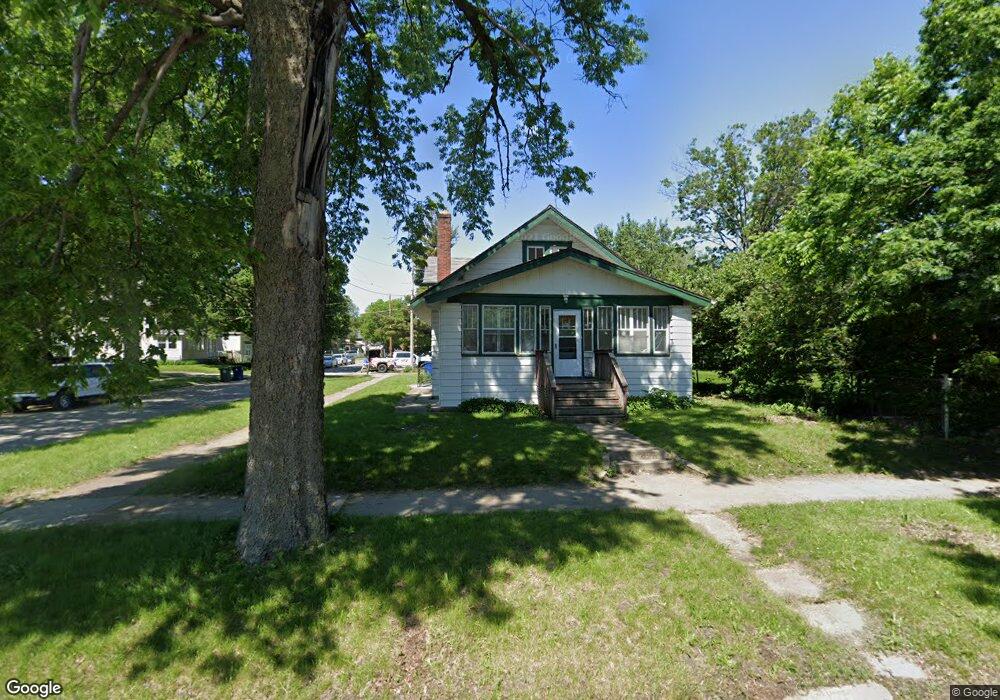
1003 Logan Ave Waterloo, IA 50703
Common Grounds NeighborhoodEstimated Value: $73,000 - $94,451
4
Beds
1
Bath
1,832
Sq Ft
$45/Sq Ft
Est. Value
About This Home
This home is located at 1003 Logan Ave, Waterloo, IA 50703 and is currently estimated at $82,113, approximately $44 per square foot. 1003 Logan Ave is a home located in Black Hawk County with nearby schools including Lincoln Elementary School, George Washington Carver Academy, and East High School.
Ownership History
Date
Name
Owned For
Owner Type
Purchase Details
Closed on
Jun 26, 2013
Sold by
Uni Cu
Bought by
S & I Investment Llc
Current Estimated Value
Purchase Details
Closed on
Apr 10, 2013
Sold by
Williams Francine and Estate Of Mary Frances William
Bought by
Uni Credit Union
Create a Home Valuation Report for This Property
The Home Valuation Report is an in-depth analysis detailing your home's value as well as a comparison with similar homes in the area
Home Values in the Area
Average Home Value in this Area
Purchase History
| Date | Buyer | Sale Price | Title Company |
|---|---|---|---|
| S & I Investment Llc | $35,000 | None Available | |
| Uni Credit Union | $46,000 | None Available |
Source: Public Records
Tax History Compared to Growth
Tax History
| Year | Tax Paid | Tax Assessment Tax Assessment Total Assessment is a certain percentage of the fair market value that is determined by local assessors to be the total taxable value of land and additions on the property. | Land | Improvement |
|---|---|---|---|---|
| 2025 | $1,400 | $76,300 | $6,370 | $69,930 |
| 2024 | $1,400 | $64,520 | $6,370 | $58,150 |
| 2023 | $1,070 | $64,520 | $6,370 | $58,150 |
| 2022 | $1,042 | $48,730 | $6,370 | $42,360 |
| 2021 | $1,070 | $48,730 | $6,370 | $42,360 |
| 2020 | $1,394 | $47,260 | $4,900 | $42,360 |
| 2019 | $2,108 | $47,260 | $4,900 | $42,360 |
| 2018 | $1,399 | $47,260 | $4,900 | $42,360 |
| 2017 | $1,054 | $47,260 | $4,900 | $42,360 |
| 2016 | $1,072 | $47,260 | $4,900 | $42,360 |
| 2015 | $1,072 | $47,260 | $4,900 | $42,360 |
| 2014 | $1,182 | $51,110 | $4,900 | $46,210 |
Source: Public Records
Map
Nearby Homes