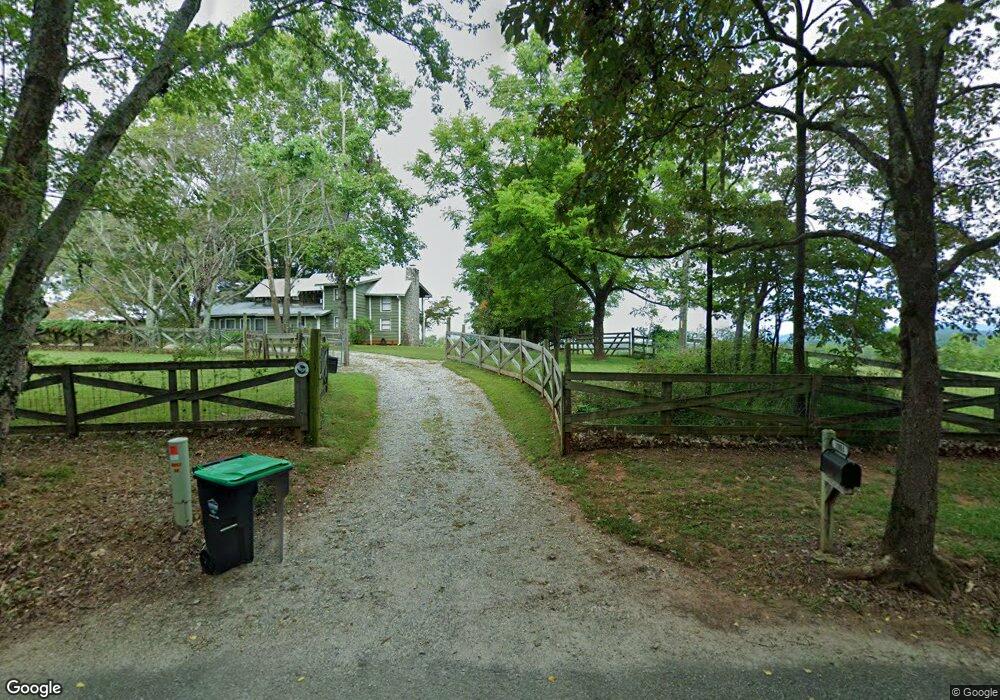
1003 Roy Grindle Rd Dahlonega, GA 30533
Estimated Value: $516,654 - $550,000
4
Beds
3
Baths
3,025
Sq Ft
$175/Sq Ft
Est. Value
About This Home
This home is located at 1003 Roy Grindle Rd, Dahlonega, GA 30533 and is currently estimated at $530,551, approximately $175 per square foot. 1003 Roy Grindle Rd is a home located in Lumpkin County with nearby schools including Lumpkin County High School.
Ownership History
Date
Name
Owned For
Owner Type
Purchase Details
Closed on
Dec 16, 2016
Sold by
Whitaker Fam Living Trust
Bought by
Harvey Nancy A and Harvey Steven A
Current Estimated Value
Purchase Details
Closed on
Jul 29, 2016
Sold by
Richie S Suc-Trust
Bought by
Marshall David L
Purchase Details
Closed on
Jul 1, 2016
Sold by
Richie S
Bought by
Whitaker Richard S and Whitaker Susan D
Purchase Details
Closed on
Dec 9, 2010
Sold by
Whitaker Robert D and Whitaker Richie
Bought by
Whitaker Robert D & Richie Co-Trustees
Purchase Details
Closed on
Aug 12, 2003
Sold by
Whitaker Robert D & Richie Tru
Bought by
Whitaker Robert D & Richie Trustees
Purchase Details
Closed on
Feb 15, 2003
Sold by
Stivers Robert R
Bought by
Whitaker Robert D & Richie Trustees
Purchase Details
Closed on
Jan 26, 2001
Bought by
Stivers Robert R
Purchase Details
Closed on
Dec 4, 1989
Sold by
Stivers Robert R
Bought by
Whitaker Robert D
Create a Home Valuation Report for This Property
The Home Valuation Report is an in-depth analysis detailing your home's value as well as a comparison with similar homes in the area
Home Values in the Area
Average Home Value in this Area
Purchase History
| Date | Buyer | Sale Price | Title Company |
|---|---|---|---|
| Harvey Nancy A | $260,000 | -- | |
| Marshall David L | $65,000 | -- | |
| Whitaker Richard S | $74,733 | -- | |
| Whitaker Robert D & Richie Co-Trustees | -- | -- | |
| Whitaker Robert D & Richie Trustees | -- | -- | |
| Whitaker Robert D & Richie Trustees | -- | -- | |
| Stivers Robert R | -- | -- | |
| Whitaker Robert D | $107,000 | -- |
Source: Public Records
Tax History
| Year | Tax Paid | Tax Assessment Tax Assessment Total Assessment is a certain percentage of the fair market value that is determined by local assessors to be the total taxable value of land and additions on the property. | Land | Improvement |
|---|---|---|---|---|
| 2024 | $916 | $151,740 | $40,600 | $111,140 |
| 2023 | $491 | $140,604 | $37,561 | $103,043 |
| 2022 | $709 | $132,291 | $31,304 | $100,987 |
| 2021 | $2,929 | $114,424 | $31,304 | $83,120 |
| 2020 | $2,915 | $110,494 | $29,997 | $80,497 |
| 2019 | $2,942 | $110,494 | $29,997 | $80,497 |
| 2018 | $2,854 | $100,591 | $29,997 | $70,594 |
| 2017 | $2,864 | $98,992 | $29,997 | $68,995 |
| 2016 | $2,765 | $92,444 | $33,265 | $59,179 |
| 2015 | $1,814 | $165,750 | $106,571 | $59,179 |
| 2014 | $1,814 | $167,314 | $106,571 | $60,743 |
| 2013 | -- | $168,096 | $106,571 | $61,524 |
Source: Public Records
Map
Nearby Homes
- 1063 Grindle Bridge Rd
- 100 Silver Oak Trail
- 64 Highview Ln
- 313 Hester Rd
- 98 River Rock Dr
- 5565 Cavender Creek Rd
- 0 Grindle Bridge Rd Unit 7704496
- 242 Hooper Rd
- 0 Horseshoe Bend Rd Unit 7620338
- 4541 Cavender Creek Rd
- 16 Welch Cir
- 110 Howard Ln
- 45 Chestatee River Ridge
- 499 Old Deer Path Way
- 655 Kelley Rd
- 410 Whiskey Still Dr
- 893 Hooper Rd
- 124 Candy Man Ln
- 1016 Deer Woods Trail
- 1243 Hooper Rd
- 1053 Roy Grindle Rd
- 876 Roy Grindle Rd
- 1149 Roy Grindle Rd
- 1151 Roy Grindle Rd
- 481 Roy Grindle Rd
- 26 Perry Ln
- 575 Roy Grindle Rd
- 225 Perry Ln
- 230 Perry Ln
- 483 Roy Grindle Rd
- 142 Frog Hollow Rd
- 1435 Grindle Bridge Rd
- 1383 Grindle Bridge Rd
- 1292 Roy Grindle Rd
- 1315 Roy Grindle Rd
- 472 Roy Grindle Rd
- 0 Frog Hollow Rd Unit 8463478
- 0 Frog Hollow Rd
- 1375 Roy Grindle Rd
- 1561 Grindle Bridge Rd