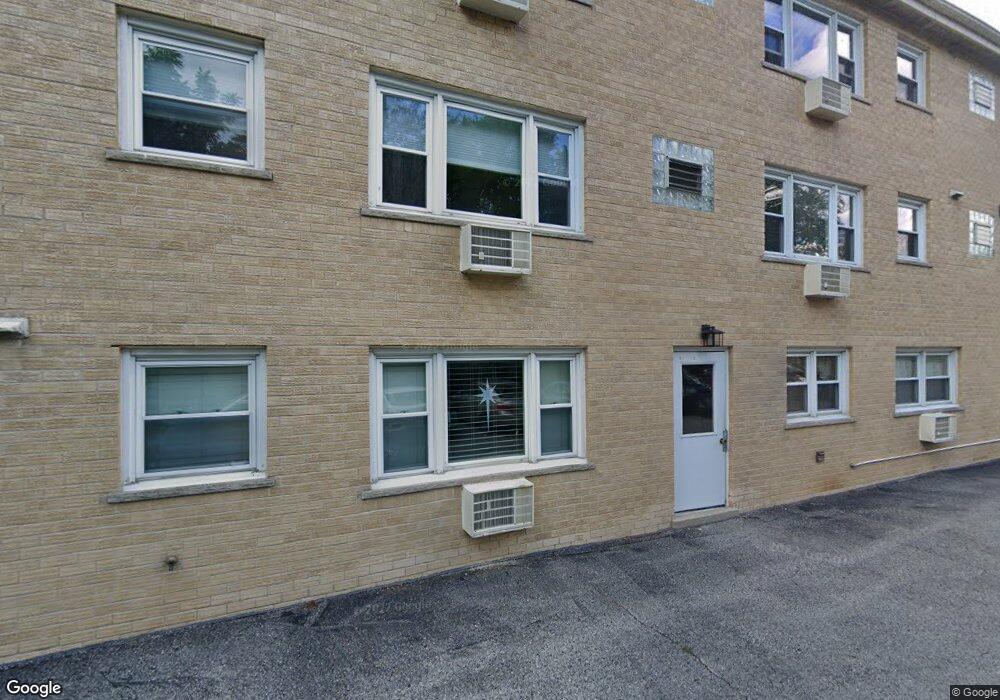
1003 S Euclid Ave Unit 3E Elmhurst, IL 60126
Estimated Value: $187,178 - $195,000
1
Bed
1
Bath
885
Sq Ft
$216/Sq Ft
Est. Value
About This Home
This home is located at 1003 S Euclid Ave Unit 3E, Elmhurst, IL 60126 and is currently estimated at $190,795, approximately $215 per square foot. 1003 S Euclid Ave Unit 3E is a home located in DuPage County with nearby schools including Pulaski Intl School of Chicago, Revere Elementary School, and Jackson Elementary School.
Ownership History
Date
Name
Owned For
Owner Type
Purchase Details
Closed on
Dec 23, 2009
Sold by
Bergl Paul H and Bergl Anna Marie F
Bought by
Bergl Vincent Joseph
Current Estimated Value
Home Financials for this Owner
Home Financials are based on the most recent Mortgage that was taken out on this home.
Original Mortgage
$105,600
Outstanding Balance
$69,090
Interest Rate
4.96%
Mortgage Type
New Conventional
Estimated Equity
$121,705
Purchase Details
Closed on
Oct 16, 2008
Sold by
Albergo Ronald A and Bergl Anna Marie F
Bought by
Bergl Paul H and Bergl Anna Marie F
Home Financials for this Owner
Home Financials are based on the most recent Mortgage that was taken out on this home.
Original Mortgage
$100,000
Interest Rate
6.41%
Mortgage Type
Purchase Money Mortgage
Purchase Details
Closed on
Feb 16, 2007
Sold by
Midwest Bank & Trust Co
Bought by
Albergo Ronald A and Bergl Anna Marie F
Create a Home Valuation Report for This Property
The Home Valuation Report is an in-depth analysis detailing your home's value as well as a comparison with similar homes in the area
Home Values in the Area
Average Home Value in this Area
Purchase History
| Date | Buyer | Sale Price | Title Company |
|---|---|---|---|
| Bergl Vincent Joseph | $132,000 | Chicago Title Insurance Co | |
| Bergl Paul H | -- | Chicago Title Insurance Co | |
| Albergo Ronald A | -- | Git |
Source: Public Records
Mortgage History
| Date | Status | Borrower | Loan Amount |
|---|---|---|---|
| Open | Bergl Vincent Joseph | $105,600 | |
| Previous Owner | Bergl Paul H | $100,000 |
Source: Public Records
Tax History Compared to Growth
Tax History
| Year | Tax Paid | Tax Assessment Tax Assessment Total Assessment is a certain percentage of the fair market value that is determined by local assessors to be the total taxable value of land and additions on the property. | Land | Improvement |
|---|---|---|---|---|
| 2024 | $2,679 | $52,459 | $5,245 | $47,214 |
| 2023 | $2,459 | $48,510 | $4,850 | $43,660 |
| 2022 | $2,303 | $43,980 | $4,410 | $39,570 |
| 2021 | $2,239 | $42,890 | $4,300 | $38,590 |
| 2020 | $2,147 | $41,950 | $4,210 | $37,740 |
| 2019 | $2,087 | $39,880 | $4,000 | $35,880 |
| 2018 | $1,845 | $35,780 | $3,590 | $32,190 |
| 2017 | $1,443 | $28,640 | $2,870 | $25,770 |
| 2016 | $1,044 | $21,730 | $2,170 | $19,560 |
| 2015 | $1,008 | $20,240 | $2,020 | $18,220 |
| 2014 | $1,134 | $20,710 | $2,070 | $18,640 |
| 2013 | $2,078 | $33,670 | $3,380 | $30,290 |
Source: Public Records
Map
Nearby Homes
- 100 W Butterfield Rd Unit 112N
- 110 W Butterfield Rd Unit 502S
- 162 E Hale St
- 1005 S Mitchell Ave
- 995 S Swain Ave
- 936 S Mitchell Ave
- 991 S Swain Ave
- 175 W Brush Hill Rd Unit 404
- 837 S Kearsage Ave
- 963 S Saylor Ave
- 900 S Colfax Ave
- 1200 S Prospect Ave Unit 303
- 1200 S Prospect Ave Unit 108
- 2 S Atrium Way Unit 203
- 15W320 Concord St
- 353 E Butterfield Rd
- 814 S Saylor Ave
- 185 E Oneida Ave
- 805 S Spring Rd
- 801 S Spring Rd
- 1003 S Euclid Ave Unit 2E
- 999 S Euclid Ave Unit 2N
- 999 S Euclid Ave Unit 1N
- 999 S Euclid Ave Unit 1S
- 1001 S Euclid Ave Unit 3S
- 999 S Euclid Ave Unit 2S
- 1001 S Euclid Ave Unit 2N
- 1001 S Euclid Ave Unit 3N
- 1003 S Euclid Ave Unit 2W
- 1001 S Euclid Ave Unit 2S
- 1001 S Euclid Ave Unit 1S
- 1003 S Euclid Ave Unit 3W
- 999 S Euclid Ave Unit 3S
- 999 S Euclid Ave Unit 3N
- 1003 S Euclid Ave Unit 1
- 1001 S Euclid Ave Unit 1N
- 1001 S Euclid Ave
- 108 E Knighton Place
- 112 E Knighton Place
- 110 E Knighton Place