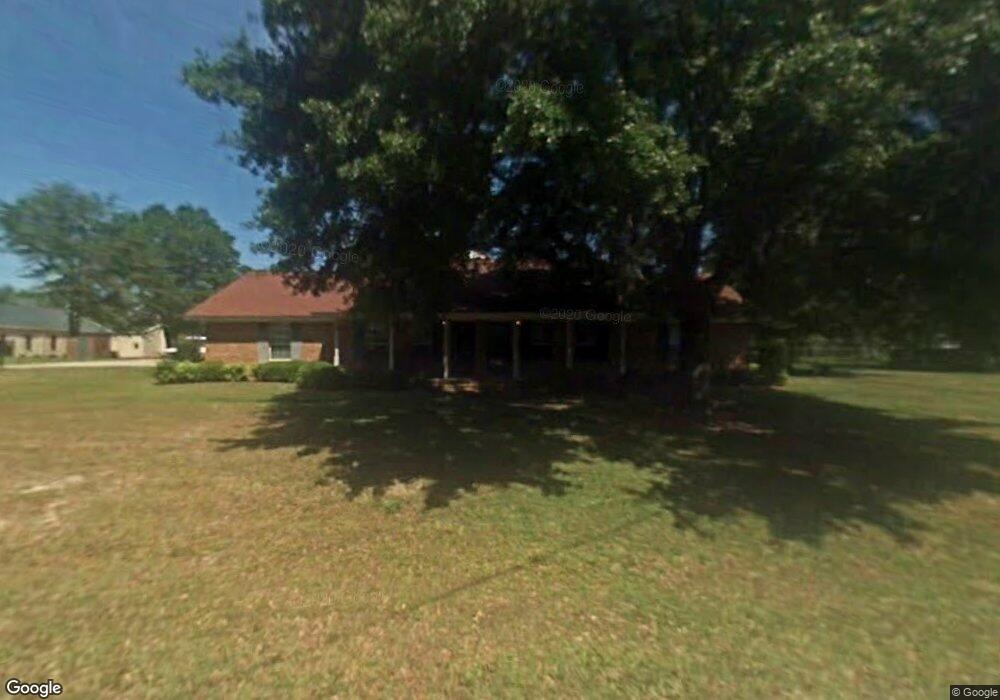
1003 Springdale Rd Unit C-2 Dublin, GA 31021
Estimated Value: $193,000 - $440,296
Studio
2
Baths
2,262
Sq Ft
$153/Sq Ft
Est. Value
About This Home
This home is located at 1003 Springdale Rd Unit C-2, Dublin, GA 31021 and is currently estimated at $346,574, approximately $153 per square foot. 1003 Springdale Rd Unit C-2 is a home located in Laurens County with nearby schools including Northwest Laurens Elementary School, Southwest Laurens Elementary School, and East Laurens Primary School.
Ownership History
Date
Name
Owned For
Owner Type
Purchase Details
Closed on
Aug 18, 2021
Sold by
Meridian Property Llc
Bought by
Bravo One Llc
Current Estimated Value
Home Financials for this Owner
Home Financials are based on the most recent Mortgage that was taken out on this home.
Original Mortgage
$183,750
Outstanding Balance
$166,580
Interest Rate
2.7%
Mortgage Type
New Conventional
Estimated Equity
$179,994
Purchase Details
Closed on
Oct 20, 2015
Sold by
Clark & Son Real Estate In
Bought by
Meridian Property Llc
Home Financials for this Owner
Home Financials are based on the most recent Mortgage that was taken out on this home.
Original Mortgage
$180,511
Interest Rate
3.89%
Mortgage Type
New Conventional
Purchase Details
Closed on
Jul 31, 2003
Sold by
Romine Jerry A
Bought by
Clark & Sons Real Estate Investments Llc
Purchase Details
Closed on
Oct 31, 1987
Bought by
Romine Jerry A
Create a Home Valuation Report for This Property
The Home Valuation Report is an in-depth analysis detailing your home's value as well as a comparison with similar homes in the area
Home Values in the Area
Average Home Value in this Area
Purchase History
| Date | Buyer | Sale Price | Title Company |
|---|---|---|---|
| Bravo One Llc | -- | -- | |
| Meridian Property Llc | $200,000 | -- | |
| Clark & Sons Real Estate Investments Llc | $180,000 | -- | |
| Romine Jerry A | -- | -- |
Source: Public Records
Mortgage History
| Date | Status | Borrower | Loan Amount |
|---|---|---|---|
| Open | Bravo One Llc | $183,750 | |
| Previous Owner | Meridian Property Llc | $180,511 |
Source: Public Records
Tax History
| Year | Tax Paid | Tax Assessment Tax Assessment Total Assessment is a certain percentage of the fair market value that is determined by local assessors to be the total taxable value of land and additions on the property. | Land | Improvement |
|---|---|---|---|---|
| 2024 | $1,142 | $54,278 | $3,600 | $50,678 |
| 2023 | $1,176 | $55,365 | $5,940 | $49,425 |
| 2022 | $1,276 | $55,365 | $5,940 | $49,425 |
| 2021 | $2,363 | $99,200 | $5,940 | $93,260 |
| 2020 | $2,365 | $99,200 | $5,940 | $93,260 |
| 2019 | $2,367 | $99,200 | $5,940 | $93,260 |
| 2018 | $2,005 | $99,200 | $5,940 | $93,260 |
| 2017 | $2,004 | $99,200 | $5,940 | $93,260 |
| 2016 | $2,177 | $99,200 | $5,940 | $93,260 |
| 2015 | $2,371 | $99,200 | $5,940 | $93,260 |
| 2014 | $1,568 | $60,998 | $5,400 | $55,598 |
Source: Public Records
Map
Nearby Homes
- 107 Westchester Cir
- 404 Cloverdale Dr
- 239 Brookwood Dr
- 305 Ridgecrest Rd
- 228 Brookwood Dr
- 206 Ridge Cir
- 1610 Lance Dr
- 220 Brookwood Dr
- 500 Payne Place
- 502 Payne Place
- 100 Cheek Dr
- 230 Ridge Cir
- 504 Payne Place
- 234 Ridge Cir
- 214 Brookwood Dr
- 274 Trinity Rd
- 311 Fairmont Dr
- 600 Live Oak Way
- 0 Brookhaven Dr Unit 10676829
- 0 Brookhaven Dr Unit 18954
- 1003 Springdale Rd
- 1003 Springdale Rd Unit C-1
- 1003 Springdale Rd Unit C-1
- 1003 Springdale Rd Unit C-2
- 1003 Springdale Rd
- 1003 Springdale Rd
- 1001 Springdale Rd
- 1002 Springdale Rd
- 905 Springdale Rd
- 905 Springdale Rd
- 1003 C-1 Springdale Rd
- 1007 Springdale Rd
- 1004 Springdale Rd
- 429 Eastwood Dr
- 1006 Springdale Rd
- 427 Eastwood Dr
- 424 Eastwood Dr
- 902 Springdale Rd
- 1008 Springdale Rd
- 805 Springdale Rd
Your Personal Tour Guide
Ask me questions while you tour the home.