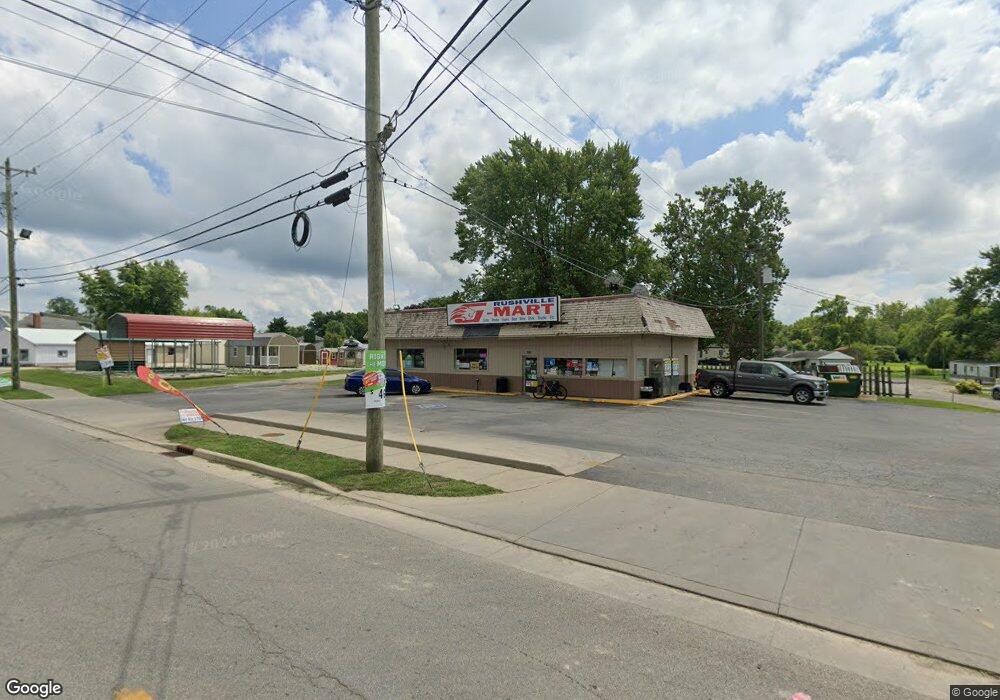
1003 W 3rd St Rushville, IN 46173
Estimated Value: $171,000 - $228,000
--
Bed
--
Bath
2,030
Sq Ft
$98/Sq Ft
Est. Value
About This Home
This home is located at 1003 W 3rd St, Rushville, IN 46173 and is currently estimated at $199,219, approximately $98 per square foot. 1003 W 3rd St is a home located in Rush County with nearby schools including Rushville Consolidated High School and St. Mary Catholic School.
Ownership History
Date
Name
Owned For
Owner Type
Purchase Details
Closed on
Feb 22, 2024
Sold by
Stone Family Trust
Bought by
Shady Acres Llc
Current Estimated Value
Purchase Details
Closed on
Sep 29, 2023
Sold by
Campbell Properties Group Llc
Bought by
Stone Family Trust and Stone
Purchase Details
Closed on
May 23, 2022
Sold by
Campbell Properties Group Llc
Bought by
State Of Indiana
Purchase Details
Closed on
Jul 19, 2018
Sold by
Campbell Brian J and Campbell Tonya R
Bought by
Campbell Properties Group Llc
Purchase Details
Closed on
Apr 18, 2014
Sold by
Hadix Jacob
Bought by
Campbell Brian J and Campbell Tonya R
Purchase Details
Closed on
Sep 11, 2012
Sold by
Elysabeth Lorraine
Bought by
Hadix Jacob
Create a Home Valuation Report for This Property
The Home Valuation Report is an in-depth analysis detailing your home's value as well as a comparison with similar homes in the area
Home Values in the Area
Average Home Value in this Area
Purchase History
| Date | Buyer | Sale Price | Title Company |
|---|---|---|---|
| Shady Acres Llc | -- | None Listed On Document | |
| Stone Family Trust | -- | None Listed On Document | |
| State Of Indiana | $18,800 | -- | |
| Campbell Properties Group Llc | -- | None Available | |
| Campbell Brian J | -- | None Available | |
| Hadix Jacob | -- | None Available |
Source: Public Records
Tax History Compared to Growth
Tax History
| Year | Tax Paid | Tax Assessment Tax Assessment Total Assessment is a certain percentage of the fair market value that is determined by local assessors to be the total taxable value of land and additions on the property. | Land | Improvement |
|---|---|---|---|---|
| 2024 | $3,183 | $152,700 | $61,500 | $91,200 |
| 2023 | $3,162 | $149,000 | $61,500 | $87,500 |
| 2022 | $2,768 | $129,300 | $64,100 | $65,200 |
| 2021 | $2,581 | $120,600 | $60,300 | $60,300 |
| 2020 | $2,603 | $121,700 | $60,300 | $61,400 |
| 2019 | $2,607 | $121,900 | $60,300 | $61,600 |
| 2018 | $2,655 | $124,300 | $60,300 | $64,000 |
| 2017 | $2,623 | $123,000 | $60,300 | $62,700 |
| 2016 | $2,639 | $123,800 | $60,300 | $63,500 |
| 2014 | $1,810 | $90,300 | $31,200 | $59,100 |
| 2013 | $1,810 | $90,500 | $31,200 | $59,300 |
Source: Public Records
Map
Nearby Homes