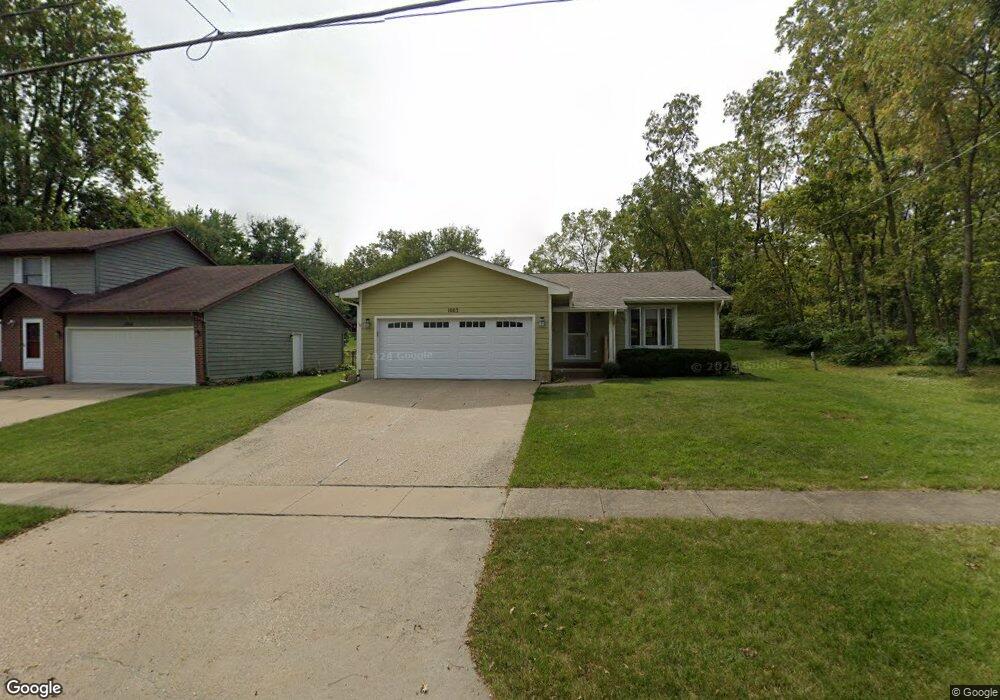
1003 W Euclid Ave Indianola, IA 50125
Estimated Value: $301,212 - $314,000
4
Beds
5
Baths
1,352
Sq Ft
$227/Sq Ft
Est. Value
About This Home
This home is located at 1003 W Euclid Ave, Indianola, IA 50125 and is currently estimated at $307,553, approximately $227 per square foot. 1003 W Euclid Ave is a home located in Warren County with nearby schools including Indianola High School.
Ownership History
Date
Name
Owned For
Owner Type
Purchase Details
Closed on
Apr 24, 2023
Sold by
Gavin David T and Gavin Janette F
Bought by
David And Janette Gavin Revocable Trust
Current Estimated Value
Purchase Details
Closed on
Sep 27, 2007
Sold by
Gavin David T and Gavin Janette F
Bought by
Konrad Martin W and Konrad Marcia R
Home Financials for this Owner
Home Financials are based on the most recent Mortgage that was taken out on this home.
Original Mortgage
$55,000
Interest Rate
6.55%
Mortgage Type
New Conventional
Create a Home Valuation Report for This Property
The Home Valuation Report is an in-depth analysis detailing your home's value as well as a comparison with similar homes in the area
Home Values in the Area
Average Home Value in this Area
Purchase History
| Date | Buyer | Sale Price | Title Company |
|---|---|---|---|
| David And Janette Gavin Revocable Trust | -- | None Listed On Document | |
| Konrad Martin W | $187,000 | None Available |
Source: Public Records
Mortgage History
| Date | Status | Borrower | Loan Amount |
|---|---|---|---|
| Previous Owner | Konrad Martin W | $55,000 |
Source: Public Records
Tax History Compared to Growth
Tax History
| Year | Tax Paid | Tax Assessment Tax Assessment Total Assessment is a certain percentage of the fair market value that is determined by local assessors to be the total taxable value of land and additions on the property. | Land | Improvement |
|---|---|---|---|---|
| 2024 | $4,666 | $277,700 | $31,900 | $245,800 |
| 2023 | $5,014 | $277,700 | $31,900 | $245,800 |
| 2022 | $4,962 | $244,200 | $31,900 | $212,300 |
| 2021 | $4,952 | $244,200 | $31,900 | $212,300 |
| 2020 | $4,952 | $230,400 | $31,900 | $198,500 |
| 2019 | $4,874 | $230,400 | $31,900 | $198,500 |
| 2018 | $4,660 | $224,000 | $0 | $0 |
| 2017 | $4,660 | $224,000 | $0 | $0 |
| 2016 | $4,290 | $206,700 | $0 | $0 |
| 2015 | $4,290 | $206,700 | $0 | $0 |
| 2014 | $4,144 | $200,200 | $0 | $0 |
Source: Public Records
Map
Nearby Homes