
Seller's Agent in 2015
Ruby Letendre
Market South Properties Inc.
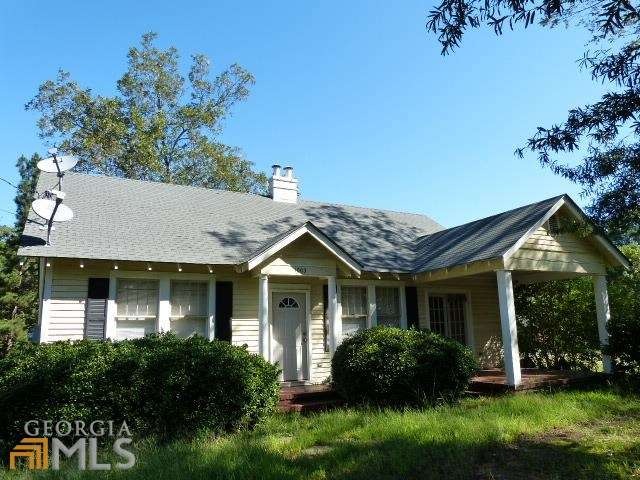
1. 1003 W. SOLOMON ST---057 02024-3 BEDROOM, 2 BATH
Last Agent to Sell the Property
Ruby Letendre
Market South Properties Inc. License #178977 Listed on: 09/24/2014
Last Buyer's Agent
Ruby Letendre
Market South Properties Inc. License #178977 Listed on: 09/24/2014
Home Type
Est. Annual Taxes
Year Built
Interior Spaces
Schools
| Date | Type | Sale Price | Title Company |
|---|---|---|---|
| Warranty Deed | $28,000 | -- | |
| Warranty Deed | $17,500 | -- | |
| Foreclosure Deed | $18,100 | -- | |
| Deed | $36,000 | -- | |
| Foreclosure Deed | $51,368 | -- | |
| Deed | $55,000 | -- | |
| Deed | $46,000 | -- | |
| Deed | $42,000 | -- | |
| Deed | $32,500 | -- | |
| Deed | -- | -- | |
| Deed | -- | -- | |
| Deed | $11,600 | -- |
| Date | Status | Loan Amount | Loan Type |
|---|---|---|---|
| Previous Owner | $50,000 | New Conventional | |
| Previous Owner | $50,000 | New Conventional | |
| Previous Owner | $37,899 | New Conventional |
| Date | Event | Price | Change | Sq Ft Price |
|---|---|---|---|---|
| 01/06/2015 01/06/15 | Sold | $28,000 | -6.4% | $24 / Sq Ft |
| 12/17/2014 12/17/14 | Pending | -- | -- | -- |
| 12/12/2014 12/12/14 | Price Changed | $29,900 | -6.3% | $26 / Sq Ft |
| 12/06/2014 12/06/14 | For Sale | $31,900 | +82.3% | $28 / Sq Ft |
| 12/05/2014 12/05/14 | Sold | $17,500 | -82.5% | $15 / Sq Ft |
| 11/18/2014 11/18/14 | Pending | -- | -- | -- |
| 11/14/2014 11/14/14 | Price Changed | $100,000 | 0.0% | $87 / Sq Ft |
| 11/14/2014 11/14/14 | For Sale | $100,000 | -11.4% | $87 / Sq Ft |
| 11/05/2014 11/05/14 | Pending | -- | -- | -- |
| 10/24/2014 10/24/14 | Price Changed | $112,900 | -2.6% | $98 / Sq Ft |
| 10/02/2014 10/02/14 | Price Changed | $115,900 | -3.3% | $101 / Sq Ft |
| 09/24/2014 09/24/14 | For Sale | $119,900 | -- | $104 / Sq Ft |
| Year | Tax Paid | Tax Assessment Tax Assessment Total Assessment is a certain percentage of the fair market value that is determined by local assessors to be the total taxable value of land and additions on the property. | Land | Improvement |
|---|---|---|---|---|
| 2024 | $917 | $26,314 | $3,840 | $22,474 |
| 2023 | $917 | $24,066 | $3,840 | $20,226 |
| 2022 | $715 | $20,257 | $2,400 | $17,857 |
| 2021 | $633 | $18,194 | $2,400 | $15,794 |
| 2020 | $633 | $18,194 | $2,400 | $15,794 |
| 2019 | $597 | $17,020 | $2,280 | $14,740 |
| 2018 | $639 | $17,489 | $2,280 | $15,209 |
| 2017 | $723 | $17,489 | $2,280 | $15,209 |
| 2016 | $470 | $17,489 | $2,280 | $15,209 |
| 2015 | $299 | $17,489 | $2,280 | $15,209 |
| 2014 | $769 | $18,575 | $2,280 | $16,295 |
Seller's Agent in 2015
Ruby Letendre
Market South Properties Inc.
Buyer's Agent in 2015
Mahria Clarke
BHHS Georgia Properties
(770) 713-8862
7 in this area
67 Total Sales
Source: Georgia MLS
MLS Number: 07340986
APN: 057-02-024
Disclaimer: Certain information contained herein is derived from information provided by parties other than Homes.com. All information provided is deemed reliable, but is not guaranteed to be accurate and should be independently verified.
![]() The data relating to real estate for sale on this web site comes in part from the Broker Reciprocity Program of Georgia MLS. Real estate listings held by brokerage firms other than Redfin are marked with the Broker Reciprocity logo and detailed information about them includes the name of the listing brokers. Information deemed reliable but not guaranteed. Copyright 2025 Georgia MLS. All rights reserved.
The data relating to real estate for sale on this web site comes in part from the Broker Reciprocity Program of Georgia MLS. Real estate listings held by brokerage firms other than Redfin are marked with the Broker Reciprocity logo and detailed information about them includes the name of the listing brokers. Information deemed reliable but not guaranteed. Copyright 2025 Georgia MLS. All rights reserved.