Estimated Value: $250,000 - $285,000
3
Beds
2
Baths
1,002
Sq Ft
$270/Sq Ft
Est. Value
About This Home
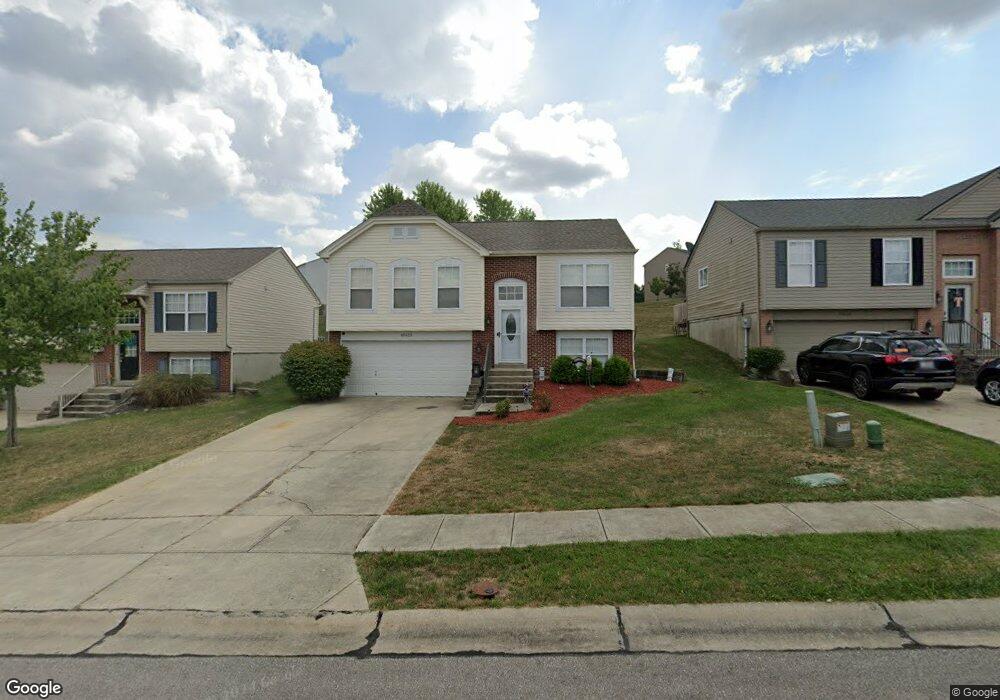
This home is located at 10032 Armstrong St Unit 187, Union, KY 41091 and is currently estimated at $270,952, approximately $270 per square foot. 10032 Armstrong St Unit 187 is a home located in Boone County with nearby schools including Longbranch Elementary School, Ockerman Middle School, and Randall K. Cooper High School.
Ownership History
Date
Name
Owned For
Owner Type
Purchase Details
Closed on
May 4, 2022
Sold by
Kyle Fuller
Bought by
Donavan Marsha
Current Estimated Value
Purchase Details
Closed on
Oct 9, 2020
Sold by
Scott Matthew S and Scott Janell M
Bought by
Fuller Kyle and Groh Courtney
Home Financials for this Owner
Home Financials are based on the most recent Mortgage that was taken out on this home.
Original Mortgage
$178,703
Interest Rate
2.9%
Mortgage Type
FHA
Purchase Details
Closed on
Apr 5, 2013
Sold by
Dichiara Joseph R and Balducci Lisa
Bought by
Scott Matthew W and Scott Janell M
Home Financials for this Owner
Home Financials are based on the most recent Mortgage that was taken out on this home.
Original Mortgage
$94,261
Interest Rate
3.37%
Mortgage Type
FHA
Purchase Details
Closed on
Feb 16, 2005
Sold by
Maple Street Homes Llc
Bought by
Dichiara Joseph R and Balducci Lisas
Create a Home Valuation Report for This Property
The Home Valuation Report is an in-depth analysis detailing your home's value as well as a comparison with similar homes in the area
Home Values in the Area
Average Home Value in this Area
Purchase History
| Date | Buyer | Sale Price | Title Company |
|---|---|---|---|
| Donavan Marsha | $237,500 | Northwest Title | |
| Fuller Kyle | $182,000 | Springdale Title Llc | |
| Scott Matthew W | $96,000 | Bridge Trust Title Group | |
| Dichiara Joseph R | $131,445 | None Available |
Source: Public Records
Mortgage History
| Date | Status | Borrower | Loan Amount |
|---|---|---|---|
| Previous Owner | Fuller Kyle | $178,703 | |
| Previous Owner | Scott Matthew W | $94,261 |
Source: Public Records
Tax History Compared to Growth
Tax History
| Year | Tax Paid | Tax Assessment Tax Assessment Total Assessment is a certain percentage of the fair market value that is determined by local assessors to be the total taxable value of land and additions on the property. | Land | Improvement |
|---|---|---|---|---|
| 2024 | $1,539 | $162,000 | $30,000 | $132,000 |
| 2023 | $1,528 | $162,000 | $30,000 | $132,000 |
| 2022 | $1,725 | $182,000 | $30,000 | $152,000 |
| 2021 | $2,252 | $182,000 | $30,000 | $152,000 |
| 2020 | $1,364 | $140,600 | $30,000 | $110,600 |
| 2019 | $1,027 | $105,000 | $24,000 | $81,000 |
| 2018 | $1,084 | $105,000 | $24,000 | $81,000 |
| 2017 | $1,016 | $105,000 | $24,000 | $81,000 |
| 2015 | $1,008 | $105,000 | $24,000 | $81,000 |
| 2013 | -- | $131,450 | $24,000 | $107,450 |
Source: Public Records
Map
Nearby Homes
- 2150 Antoinette Way
- 2238 Algiers St
- 9412 Dauphine Dr
- 2159 Algiers St
- 8429 Saint Louis Blvd
- 8426 Saint Louis Blvd
- 2350 Antoinette Way
- 2142 Algiers St
- 8636 Eden Ct
- 8720 Eden Ct
- 8629 Treeline Dr
- 2709 Longbranch Rd
- 8253 Heatherwood Dr
- 2719 Chateau Ct
- 5004 Loch Dr
- 5013 Loch Dr
- 3029 Nottoway Ct
- 2381 Longbranch-New Build Rd
- 2381 Longbranch Rd-Lot 3 Rd
- 2381 Longbranch Rd-Lot 1 Rd
- 10032 Armstrong St
- 10036 Armstrong St
- 10036 Armstrong St Unit 188
- 10028 Armstrong St
- 0 Armstrong St Unit TO186 305117
- 0 Armstrong St Unit TO202 305480
- 0 Armstrong St Unit TO68
- 10024 Armstrong St
- 10024 Armstrong St Unit TO185
- 10044 Armstrong St
- 10044 Armstrong St Unit 189
- 2270 Algiers St
- 2266 Algiers St
- 2266 Algiers St Unit 219
- 10048 Armstrong St
- 10048 Armstrong St Unit 190
- 2274 Algiers St
- 2262 Algiers St
- 2262 Algiers St Unit 218
- 10029 Armstrong St