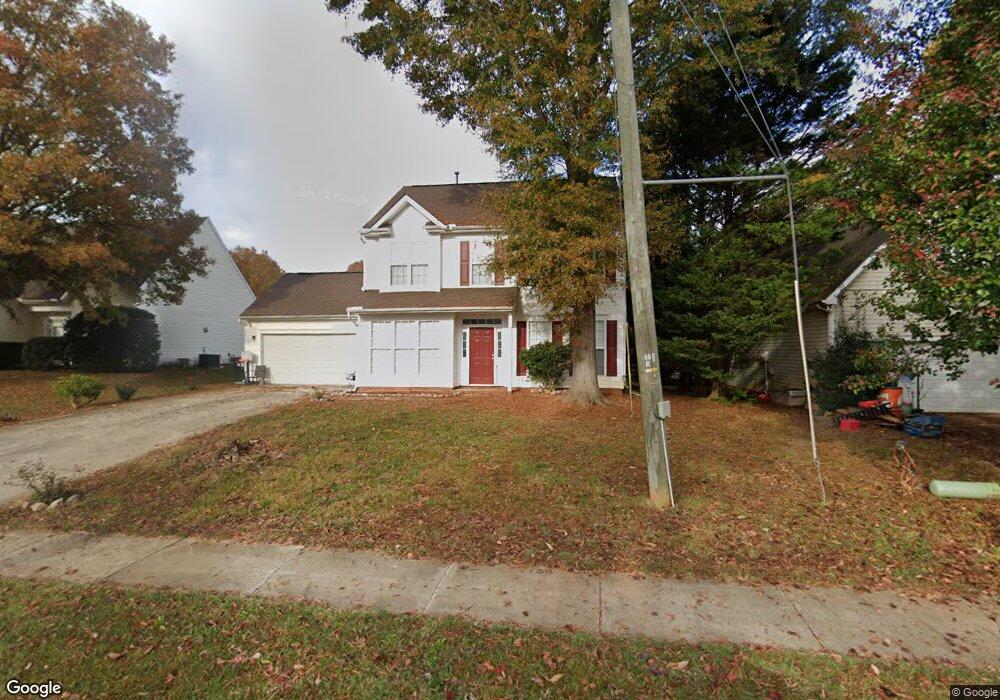
10033 Brawley Ln Charlotte, NC 28215
Silverwood NeighborhoodEstimated Value: $326,000 - $345,000
3
Beds
3
Baths
1,688
Sq Ft
$197/Sq Ft
Est. Value
About This Home
This home is located at 10033 Brawley Ln, Charlotte, NC 28215 and is currently estimated at $332,034, approximately $196 per square foot. 10033 Brawley Ln is a home located in Mecklenburg County with nearby schools including Reedy Creek Elementary School, Northridge Middle School, and Rocky River High School.
Ownership History
Date
Name
Owned For
Owner Type
Purchase Details
Closed on
Oct 15, 2018
Sold by
Offerpad Spvborrower1 Llc
Bought by
Property Owner 7 Llc
Current Estimated Value
Purchase Details
Closed on
Sep 11, 2018
Sold by
Thomas James
Bought by
Offerpad Llc and Spvborrower I Llc
Purchase Details
Closed on
May 24, 2004
Sold by
Deutsche Bank National Trust Co
Bought by
Thomas James
Home Financials for this Owner
Home Financials are based on the most recent Mortgage that was taken out on this home.
Original Mortgage
$114,975
Interest Rate
5.98%
Mortgage Type
VA
Purchase Details
Closed on
Aug 29, 2003
Sold by
Bonner James P
Bought by
Deutsche Bank National Trust Co and Imh Assets Corp Collateralized Asset Bac
Purchase Details
Closed on
Apr 30, 2002
Sold by
Craft Homes Usa Llc
Bought by
Thomas Lashawn
Home Financials for this Owner
Home Financials are based on the most recent Mortgage that was taken out on this home.
Original Mortgage
$157,600
Interest Rate
9.37%
Create a Home Valuation Report for This Property
The Home Valuation Report is an in-depth analysis detailing your home's value as well as a comparison with similar homes in the area
Home Values in the Area
Average Home Value in this Area
Purchase History
| Date | Buyer | Sale Price | Title Company |
|---|---|---|---|
| Property Owner 7 Llc | $183,000 | None Available | |
| Offerpad Llc | $189,000 | None Available | |
| Thomas James | $113,000 | -- | |
| Deutsche Bank National Trust Co | $136,500 | -- | |
| Thomas Lashawn | $166,000 | -- |
Source: Public Records
Mortgage History
| Date | Status | Borrower | Loan Amount |
|---|---|---|---|
| Previous Owner | Thomas James | $114,975 | |
| Previous Owner | Thomas Lashawn | $157,600 |
Source: Public Records
Tax History Compared to Growth
Tax History
| Year | Tax Paid | Tax Assessment Tax Assessment Total Assessment is a certain percentage of the fair market value that is determined by local assessors to be the total taxable value of land and additions on the property. | Land | Improvement |
|---|---|---|---|---|
| 2025 | $2,324 | $286,700 | $85,000 | $201,700 |
| 2024 | $2,324 | $286,700 | $85,000 | $201,700 |
| 2023 | $2,242 | $286,700 | $85,000 | $201,700 |
| 2022 | $1,746 | $167,900 | $30,000 | $137,900 |
| 2021 | $1,735 | $167,900 | $30,000 | $137,900 |
| 2020 | $1,727 | $167,900 | $30,000 | $137,900 |
| 2019 | $1,712 | $167,900 | $30,000 | $137,900 |
| 2018 | $1,561 | $113,400 | $19,800 | $93,600 |
| 2017 | $1,531 | $113,400 | $19,800 | $93,600 |
| 2016 | $1,521 | $113,400 | $19,800 | $93,600 |
| 2015 | $1,510 | $113,400 | $19,800 | $93,600 |
| 2014 | $1,519 | $113,400 | $19,800 | $93,600 |
Source: Public Records
Map
Nearby Homes
- 11121 Nolet Ct
- 8112 Cambridge Commons Dr
- 8412 Bristol Ford Place
- 8502 Mansell Ct
- 8927 Little Hampton Place
- 10436 Gold Pan Rd
- 10630 Bradstreet Commons Way
- 11039 Palestrina Rd
- 7415 Foxgate Cir
- 8601 Findon Place
- 8731 Woodhill Manor Ct
- 9036 Bradstreet Commons Way
- 8953 Bradstreet Commons Way
- 8224 Teeter Dr
- 5436 Hughesdale Dr
- 9388 Hamel St
- 11601 Calgary Dr
- 9339 Bradstreet Commons Way Unit 25
- 11404 Magpie Ct Unit 11
- 11622 Sapsucker Ln Unit 70
- 10027 Brawley Ln
- 10041 Brawley Ln
- 8040 Shiny Meadow Ln
- 10021 Brawley Ln
- 0 Brawley Ln
- 8044 Shiny Meadow Ln
- 10103 Brawley Ln
- 8036 Shiny Meadow Ln
- 10042 Brawley Ln
- 10030 Brawley Ln
- 10015 Brawley Ln
- 10020 Brawley Ln Unit 46
- 10020 Brawley Ln
- 10036 Brawley Ln
- 8030 Shiny Meadow Ln
- 9107 Gatwick Ct
- 10107 Brawley Ln
- 10014 Brawley Ln
- 10040 Brawley Ln
- 8045 Shiny Meadow Ln