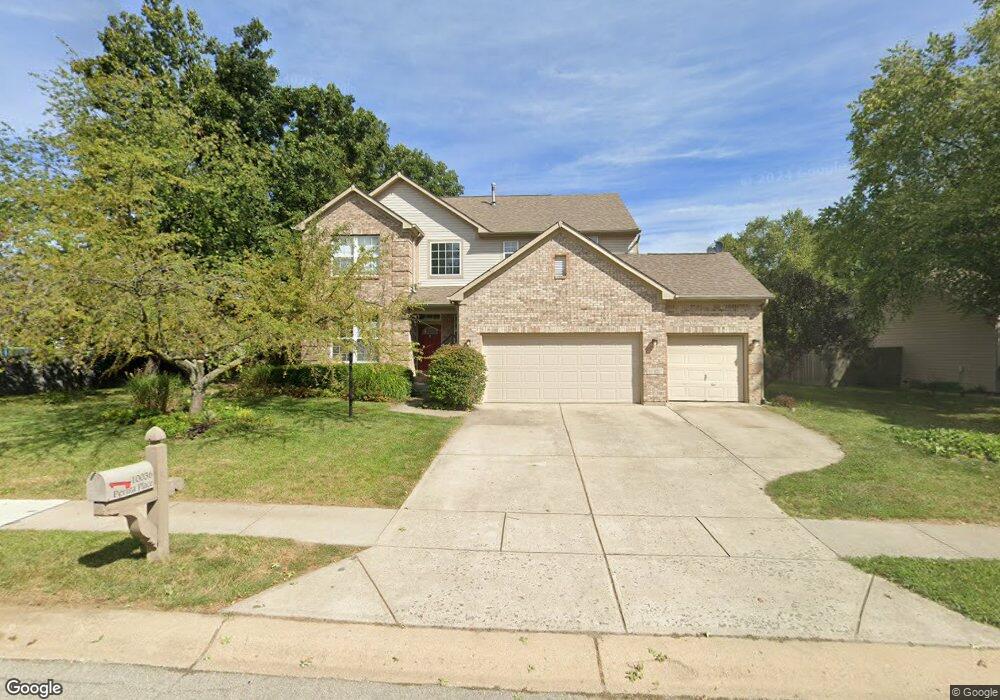
10036 Perlita Place Fishers, IN 46038
Estimated Value: $409,000 - $470,000
5
Beds
4
Baths
2,741
Sq Ft
$159/Sq Ft
Est. Value
About This Home
This home is located at 10036 Perlita Place, Fishers, IN 46038 and is currently estimated at $436,951, approximately $159 per square foot. 10036 Perlita Place is a home located in Hamilton County with nearby schools including Cumberland Road Elementary School, East Middle School, and Fishers Junior High School.
Ownership History
Date
Name
Owned For
Owner Type
Purchase Details
Closed on
Nov 28, 2005
Sold by
Mills Jason E and Mills Amy M
Bought by
Moretemore Roger J and Moretemore Aimee K
Current Estimated Value
Home Financials for this Owner
Home Financials are based on the most recent Mortgage that was taken out on this home.
Original Mortgage
$162,800
Outstanding Balance
$87,613
Interest Rate
5.75%
Mortgage Type
Fannie Mae Freddie Mac
Estimated Equity
$349,338
Purchase Details
Closed on
Jul 30, 2001
Sold by
Tran Steve and Tran Phong
Bought by
Mills Jason E and Mills Amy M
Home Financials for this Owner
Home Financials are based on the most recent Mortgage that was taken out on this home.
Original Mortgage
$175,750
Interest Rate
7.15%
Create a Home Valuation Report for This Property
The Home Valuation Report is an in-depth analysis detailing your home's value as well as a comparison with similar homes in the area
Home Values in the Area
Average Home Value in this Area
Purchase History
| Date | Buyer | Sale Price | Title Company |
|---|---|---|---|
| Moretemore Roger J | -- | -- | |
| Mills Jason E | -- | -- |
Source: Public Records
Mortgage History
| Date | Status | Borrower | Loan Amount |
|---|---|---|---|
| Open | Moretemore Roger J | $162,800 | |
| Previous Owner | Mills Jason E | $175,750 |
Source: Public Records
Tax History Compared to Growth
Tax History
| Year | Tax Paid | Tax Assessment Tax Assessment Total Assessment is a certain percentage of the fair market value that is determined by local assessors to be the total taxable value of land and additions on the property. | Land | Improvement |
|---|---|---|---|---|
| 2024 | $4,665 | $403,600 | $47,600 | $356,000 |
| 2023 | $4,380 | $384,200 | $47,600 | $336,600 |
| 2022 | $4,017 | $339,400 | $47,600 | $291,800 |
| 2021 | $3,428 | $288,500 | $47,600 | $240,900 |
| 2020 | $3,211 | $270,000 | $47,600 | $222,400 |
| 2019 | $2,961 | $249,800 | $38,400 | $211,400 |
| 2018 | $2,728 | $231,200 | $38,400 | $192,800 |
| 2017 | $2,560 | $221,900 | $38,400 | $183,500 |
| 2016 | $2,433 | $214,300 | $38,400 | $175,900 |
| 2014 | $2,075 | $198,600 | $38,400 | $160,200 |
| 2013 | $2,075 | $188,100 | $38,400 | $149,700 |
Source: Public Records
Map
Nearby Homes
- 10066 Perlita Place
- 13068 Lamarque Place
- 12991 Wingstem Ct
- 11798 & 11842 E 131st St
- 12959 Shandon Ln
- 12966 Pleasant View Ln
- 13048 Ross Crossing
- 10150 Beresford Ct
- 13125 Zinfandel Place
- 12677 Ladson St
- 10671 Pleasant View Ln
- 10513 Blue Springs Ln
- 10175 Pamona Ct
- 12638 Granite Ridge Cir
- 10713 Summerwood Ln
- 12783 Granite Ridge Cir
- 12662 Granite Ridge Cir
- 12807 Granite Ridge Cir
- 12650 Granite Ridge Cir
- 12126 Blue Springs Ln
- 10046 Perlita Place
- 12759 Glengary Dr
- 10023 Sanger Dr
- 12765 Glengary Dr
- 10056 Perlita Place
- 10043 Sanger Dr
- 12771 Glengary Dr
- 10037 Perlita Place
- 12753 Glengary Dr
- 10000 Sanger Dr
- 10057 Perlita Place
- 12839 Glengary Dr
- 10063 Sanger Dr
- 10067 Perlita Place
- 12843 Glengary Dr
- 12760 Glengary Dr
- 12766 Glengary Dr
- 12754 Glengary Dr
- 12733 Glengary Dr
- 10077 Perlita Place