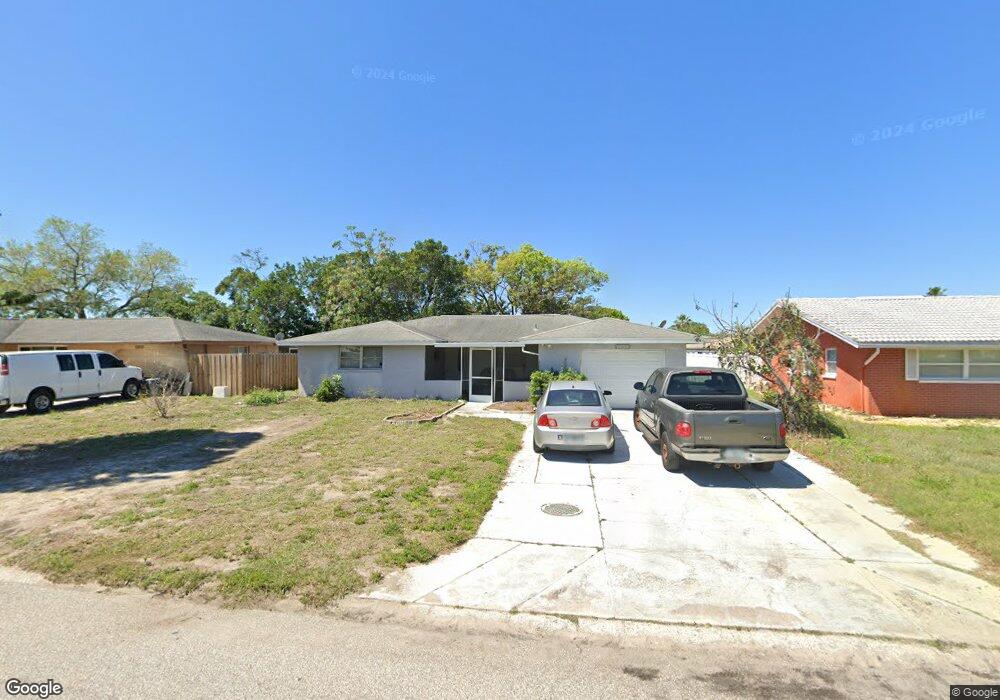
10039 Salix Ln Port Richey, FL 34668
Estimated Value: $225,000 - $248,000
3
Beds
2
Baths
1,985
Sq Ft
$120/Sq Ft
Est. Value
About This Home
This home is located at 10039 Salix Ln, Port Richey, FL 34668 and is currently estimated at $238,179, approximately $119 per square foot. 10039 Salix Ln is a home located in Pasco County with nearby schools including Fox Hollow Elementary School, Bayonet Point Middle School, and Fivay High School.
Ownership History
Date
Name
Owned For
Owner Type
Purchase Details
Closed on
Jun 30, 2025
Sold by
Eric B Hatch Trust and Hatch Eric B
Bought by
Charles Sfr Llc
Current Estimated Value
Purchase Details
Closed on
Dec 12, 2020
Sold by
Hatch Eric B
Bought by
Hatch Eric B and Eric B Hatch Trust
Purchase Details
Closed on
May 13, 2016
Sold by
Torcana Usa Inc
Bought by
Hatch Eric B
Home Financials for this Owner
Home Financials are based on the most recent Mortgage that was taken out on this home.
Original Mortgage
$73,875
Interest Rate
3.59%
Mortgage Type
New Conventional
Purchase Details
Closed on
Apr 5, 2016
Sold by
Stannard Virginia K
Bought by
Torcana Usa Inc
Home Financials for this Owner
Home Financials are based on the most recent Mortgage that was taken out on this home.
Original Mortgage
$73,875
Interest Rate
3.59%
Mortgage Type
New Conventional
Create a Home Valuation Report for This Property
The Home Valuation Report is an in-depth analysis detailing your home's value as well as a comparison with similar homes in the area
Home Values in the Area
Average Home Value in this Area
Purchase History
| Date | Buyer | Sale Price | Title Company |
|---|---|---|---|
| Charles Sfr Llc | $476,600 | Titlevest | |
| Charles Sfr Llc | $476,600 | Titlevest | |
| Hatch Eric B | -- | Accommodation | |
| Hatch Eric B | $98,500 | Island Breeze Title Inc | |
| Torcana Usa Inc | $75,000 | 1St Affiliated Title Svcs In |
Source: Public Records
Mortgage History
| Date | Status | Borrower | Loan Amount |
|---|---|---|---|
| Previous Owner | Hatch Eric B | $73,875 |
Source: Public Records
Tax History Compared to Growth
Tax History
| Year | Tax Paid | Tax Assessment Tax Assessment Total Assessment is a certain percentage of the fair market value that is determined by local assessors to be the total taxable value of land and additions on the property. | Land | Improvement |
|---|---|---|---|---|
| 2025 | $3,021 | $204,864 | $39,670 | $165,194 |
| 2024 | $3,021 | $212,026 | $39,670 | $172,356 |
| 2023 | $2,877 | $124,320 | $0 | $0 |
| 2022 | $2,323 | $173,978 | $22,620 | $151,358 |
| 2021 | $1,963 | $123,139 | $20,125 | $103,014 |
| 2020 | $1,813 | $114,186 | $12,870 | $101,316 |
| 2019 | $1,667 | $102,058 | $12,870 | $89,188 |
| 2018 | $1,493 | $86,395 | $12,870 | $73,525 |
| 2017 | $1,344 | $70,188 | $11,495 | $58,693 |
| 2016 | $604 | $53,487 | $0 | $0 |
| 2015 | $574 | $49,533 | $0 | $0 |
| 2014 | $549 | $49,029 | $7,315 | $41,714 |
Source: Public Records
Map
Nearby Homes
- 7831 Fox Hollow Dr
- 7811 Fox Hollow Dr
- 10200 Amadeus Dr
- 7835 Bloomfield Dr
- 7922 Lilac Dr
- 9830 Mark Twain Ln
- 10315 Pastel Ln
- 9826 Rainbow Ln
- 10310 Amadeus Dr Unit 6D
- 9850 Richwood Ln
- 10325 Gardenia Ln
- 10220 Willow Dr
- 10133 Peoples Loop
- 10226 Willow Dr
- 10301 Orchid Dr
- 8105 Winthrop Dr
- 9915 Aetna Ln
- 10336 Oak Hill Dr
- 8207 National Dr
- 7517 Scottie Dr
- 10033 Salix Ln
- 10103 Salix Ln
- 7839 Valmy Ln
- 10027 Salix Ln
- 7840 Pineapple Ln
- 7814 Pineapple Ln
- 10021 Salix Ln
- 7827 Pineapple Ln Unit 6C
- 7903 Valmy Ln
- 7833 Pineapple Ln
- 7902 Pineapple Ln
- 7821 Pineapple Ln
- 7840 Valmy Ln
- 7839 Pineapple Ln
- 10112 Gardenia Ln
- 7909 Valmy Ln
- 7902 Valmy Ln
- 7908 Pineapple Ln
- 7903 Pineapple Ln
- 7804 Pineapple Ln