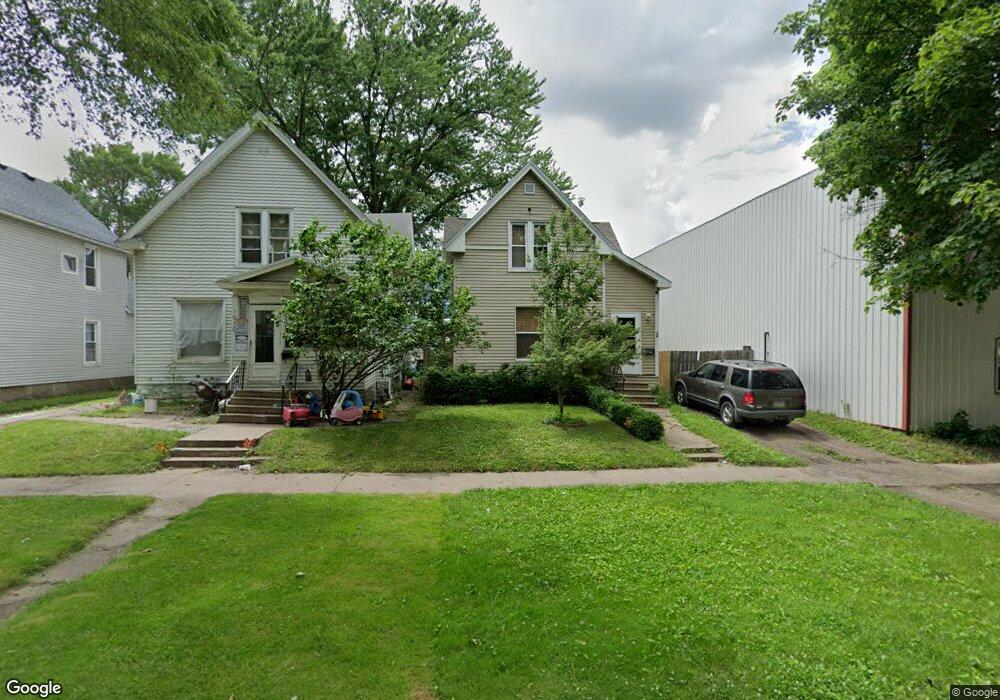
1004 10th St SW Cedar Rapids, IA 52404
Taylor NeighborhoodEstimated Value: $125,000 - $136,000
2
Beds
2
Baths
1,127
Sq Ft
$115/Sq Ft
Est. Value
About This Home
This home is located at 1004 10th St SW, Cedar Rapids, IA 52404 and is currently estimated at $129,951, approximately $115 per square foot. 1004 10th St SW is a home located in Linn County with nearby schools including Junction City Elementary School, Cedar River Academy at Taylor Elementary School, and Bruce Hall Day Treatment Center.
Ownership History
Date
Name
Owned For
Owner Type
Purchase Details
Closed on
Feb 14, 2025
Sold by
Vanderpool Brian L
Bought by
Farmers & Merchants Savings Bank
Current Estimated Value
Purchase Details
Closed on
Nov 29, 2007
Sold by
Legrand Rosalie
Bought by
Vanderpool Brian L
Home Financials for this Owner
Home Financials are based on the most recent Mortgage that was taken out on this home.
Original Mortgage
$73,000
Interest Rate
6.5%
Mortgage Type
Purchase Money Mortgage
Purchase Details
Closed on
Nov 15, 2006
Sold by
Vanderpool Brian L
Bought by
Legrand Rosalie
Home Financials for this Owner
Home Financials are based on the most recent Mortgage that was taken out on this home.
Original Mortgage
$73,000
Interest Rate
6.36%
Mortgage Type
Seller Take Back
Create a Home Valuation Report for This Property
The Home Valuation Report is an in-depth analysis detailing your home's value as well as a comparison with similar homes in the area
Home Values in the Area
Average Home Value in this Area
Purchase History
| Date | Buyer | Sale Price | Title Company |
|---|---|---|---|
| Farmers & Merchants Savings Bank | -- | None Listed On Document | |
| Vanderpool Brian L | $77,500 | None Available | |
| Legrand Rosalie | $78,000 | None Available |
Source: Public Records
Mortgage History
| Date | Status | Borrower | Loan Amount |
|---|---|---|---|
| Previous Owner | Vanderpool Brian L | $73,000 | |
| Previous Owner | Legrand Rosalie | $73,000 |
Source: Public Records
Tax History Compared to Growth
Tax History
| Year | Tax Paid | Tax Assessment Tax Assessment Total Assessment is a certain percentage of the fair market value that is determined by local assessors to be the total taxable value of land and additions on the property. | Land | Improvement |
|---|---|---|---|---|
| 2025 | $1,780 | $120,000 | $26,300 | $93,700 |
| 2024 | $1,926 | $111,000 | $23,100 | $87,900 |
| 2023 | $1,926 | $111,000 | $23,100 | $87,900 |
| 2022 | $1,772 | $100,200 | $20,000 | $80,200 |
| 2021 | $1,572 | $94,500 | $20,000 | $74,500 |
| 2020 | $1,572 | $79,800 | $16,800 | $63,000 |
| 2019 | $1,424 | $74,600 | $16,800 | $57,800 |
| 2018 | $1,380 | $74,600 | $16,800 | $57,800 |
| 2017 | $1,693 | $70,400 | $16,800 | $53,600 |
| 2016 | $1,693 | $79,700 | $16,800 | $62,900 |
| 2015 | $1,759 | $82,686 | $16,800 | $65,886 |
| 2014 | $1,574 | $86,240 | $16,000 | $70,240 |
| 2013 | $1,610 | $86,240 | $16,000 | $70,240 |
Source: Public Records
Map
Nearby Homes
- 1005 10th St SW
- 835 10th St SW
- 828 8th Ave SW
- 1424 11th St SW
- 715 9th Ave SW
- 1424 9th St SW
- 712 8th St SW
- 531 10th St SW
- 702 8th St SW
- 1121 15th Ave SW
- 531 9th St SW
- 815 15th Ave SW
- 914 6th St SW
- 1025 3rd Ave SW
- 919 6th St SW
- 1617 9th St SW
- 452 8th Ave SW
- 1118 2nd Ave SW
- 1621 9th St SW
- 657 16th Ave SW
- 1000 10th St SW
- 1016 10th St SW
- 1020 10th St SW
- 1022 10th St SW
- 1060 10th Ave SW
- 1026 10th St SW
- 1015 10th St SW
- 1001 10th St SW
- 1001 10th St SW
- 1011 10th St SW
- 1028 10th St SW
- 1019 10th St SW
- 857 10th St SW
- 844 10th St SW
- 1023 10th St SW
- 1032 10th St SW
- 851 10th St SW
- 1027 10th St SW
- 840 10th St SW
- 847 10th St SW