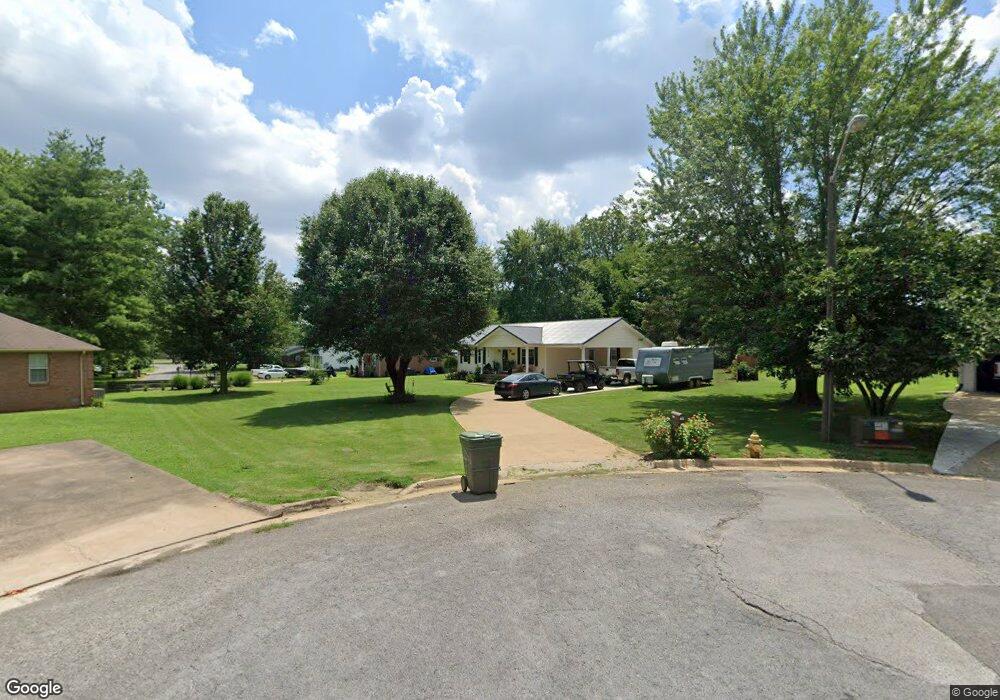
1004 Brazier Ct Lawrenceburg, TN 38464
Estimated Value: $179,175 - $246,000
--
Bed
2
Baths
1,092
Sq Ft
$201/Sq Ft
Est. Value
About This Home
This home is located at 1004 Brazier Ct, Lawrenceburg, TN 38464 and is currently estimated at $219,044, approximately $200 per square foot. 1004 Brazier Ct is a home located in Lawrence County with nearby schools including Ingram Sowell Elementary School, Lawrenceburg Public Elementary School, and David Crockett Elementary School.
Ownership History
Date
Name
Owned For
Owner Type
Purchase Details
Closed on
Jun 29, 2010
Sold by
Belew Linda Matthews
Bought by
Moore Tebra E
Current Estimated Value
Home Financials for this Owner
Home Financials are based on the most recent Mortgage that was taken out on this home.
Original Mortgage
$49,335
Outstanding Balance
$33,912
Interest Rate
5.5%
Mortgage Type
FHA
Estimated Equity
$185,132
Purchase Details
Closed on
Aug 17, 1990
Bought by
King Freddie F and Betty Ruth
Purchase Details
Closed on
Aug 29, 1986
Bought by
Pierce Shirley M
Create a Home Valuation Report for This Property
The Home Valuation Report is an in-depth analysis detailing your home's value as well as a comparison with similar homes in the area
Home Values in the Area
Average Home Value in this Area
Purchase History
| Date | Buyer | Sale Price | Title Company |
|---|---|---|---|
| Moore Tebra E | $50,000 | -- | |
| King Freddie F | $6,500 | -- | |
| Pierce Shirley M | -- | -- |
Source: Public Records
Mortgage History
| Date | Status | Borrower | Loan Amount |
|---|---|---|---|
| Open | Pierce Shirley M | $49,335 |
Source: Public Records
Tax History Compared to Growth
Tax History
| Year | Tax Paid | Tax Assessment Tax Assessment Total Assessment is a certain percentage of the fair market value that is determined by local assessors to be the total taxable value of land and additions on the property. | Land | Improvement |
|---|---|---|---|---|
| 2025 | $1,183 | $38,050 | $0 | $0 |
| 2024 | $1,183 | $38,050 | $4,375 | $33,675 |
| 2023 | $1,183 | $38,050 | $4,375 | $33,675 |
| 2022 | $1,183 | $38,050 | $4,375 | $33,675 |
| 2021 | $890 | $20,250 | $2,250 | $18,000 |
| 2020 | $890 | $20,250 | $2,250 | $18,000 |
| 2019 | $890 | $20,250 | $2,250 | $18,000 |
| 2018 | $890 | $20,250 | $2,250 | $18,000 |
| 2017 | $890 | $20,250 | $2,250 | $18,000 |
| 2016 | $890 | $20,250 | $2,250 | $18,000 |
| 2015 | $843 | $20,250 | $2,250 | $18,000 |
| 2014 | $837 | $20,100 | $2,250 | $17,850 |
Source: Public Records
Map
Nearby Homes