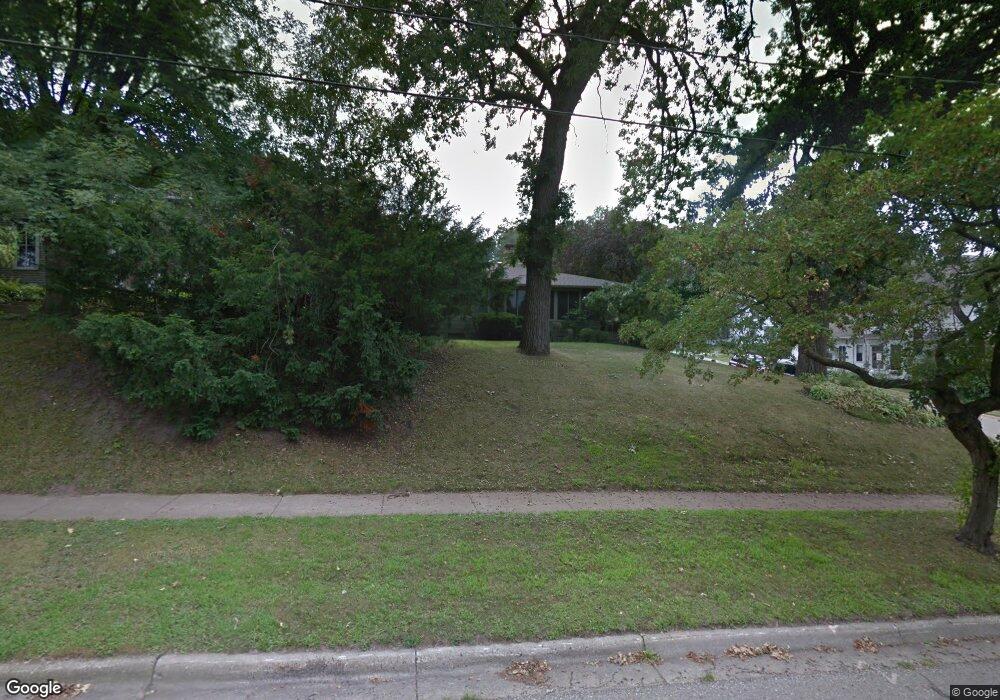
1004 East Ave Red Wing, MN 55066
Estimated Value: $305,000 - $345,000
3
Beds
2
Baths
1,771
Sq Ft
$184/Sq Ft
Est. Value
About This Home
This home is located at 1004 East Ave, Red Wing, MN 55066 and is currently estimated at $325,714, approximately $183 per square foot. 1004 East Ave is a home located in Goodhue County with nearby schools including Sunnyside Elementary School, Burnside Elementary School, and Twin Bluff Middle School.
Ownership History
Date
Name
Owned For
Owner Type
Purchase Details
Closed on
May 29, 2025
Sold by
Susan D Mahn Revocable Trust and Mahn Susan D
Bought by
Susan D Mahn Irrevocable Trust and Mahn
Current Estimated Value
Purchase Details
Closed on
Jun 21, 2010
Sold by
Lee Thomas O and Lee Joanne
Bought by
Lee Thomas O and Lee Joann
Purchase Details
Closed on
Jun 2, 2000
Sold by
Lee Carol K
Bought by
Lee Thomas and Lee Joann
Purchase Details
Closed on
Aug 31, 1998
Sold by
Wilkinson Wilkinson E and Wilkinson Jean
Bought by
Lee Carol K
Create a Home Valuation Report for This Property
The Home Valuation Report is an in-depth analysis detailing your home's value as well as a comparison with similar homes in the area
Home Values in the Area
Average Home Value in this Area
Purchase History
| Date | Buyer | Sale Price | Title Company |
|---|---|---|---|
| Susan D Mahn Irrevocable Trust | $500 | None Listed On Document | |
| Lee Thomas O | $200,000 | -- | |
| Lee Thomas | $154,000 | -- | |
| Lee Carol K | $132,500 | -- |
Source: Public Records
Tax History Compared to Growth
Tax History
| Year | Tax Paid | Tax Assessment Tax Assessment Total Assessment is a certain percentage of the fair market value that is determined by local assessors to be the total taxable value of land and additions on the property. | Land | Improvement |
|---|---|---|---|---|
| 2025 | $4,492 | $341,000 | $36,900 | $304,100 |
| 2024 | -- | $334,200 | $36,900 | $297,300 |
| 2023 | $4,276 | $312,500 | $36,900 | $275,600 |
| 2022 | $3,922 | $310,400 | $36,900 | $273,500 |
| 2021 | $3,664 | $261,700 | $36,900 | $224,800 |
| 2020 | $3,878 | $247,700 | $36,900 | $210,800 |
| 2019 | $3,834 | $245,000 | $36,900 | $208,100 |
| 2018 | $3,158 | $244,500 | $35,400 | $209,100 |
| 2017 | $2,810 | $211,200 | $35,400 | $175,800 |
| 2016 | $2,562 | $208,900 | $35,400 | $173,500 |
| 2015 | $2,444 | $201,000 | $35,400 | $165,600 |
| 2014 | -- | $191,800 | $35,400 | $156,400 |
Source: Public Records
Map
Nearby Homes