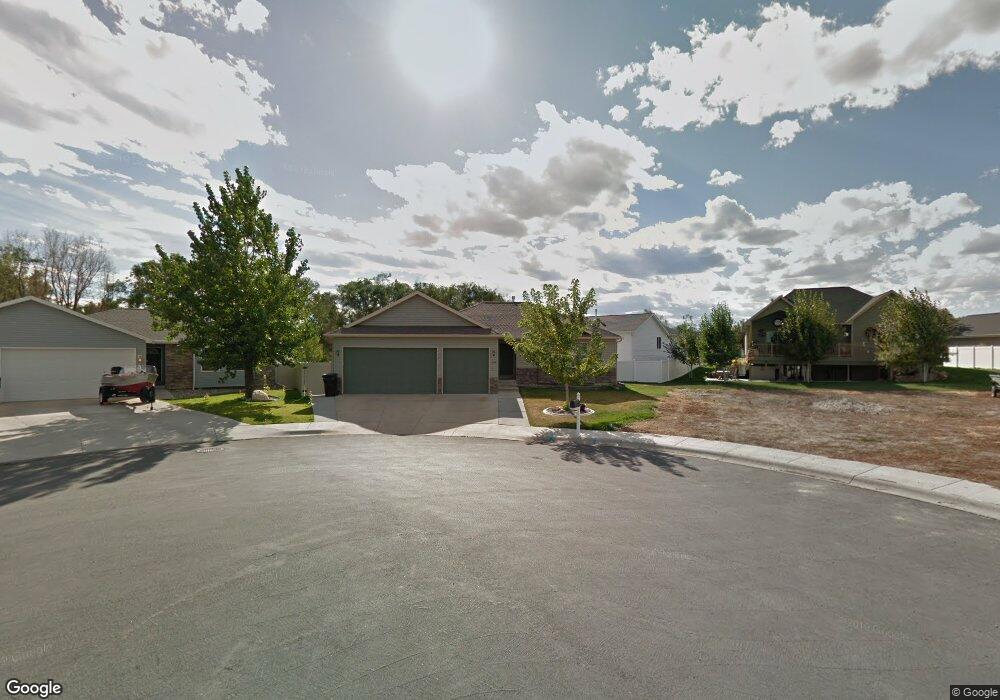
1004 Golden Spike Cir Laurel, MT 59044
Estimated Value: $369,000 - $419,000
5
Beds
3
Baths
2,429
Sq Ft
$162/Sq Ft
Est. Value
About This Home
This home is located at 1004 Golden Spike Cir, Laurel, MT 59044 and is currently estimated at $394,288, approximately $162 per square foot. 1004 Golden Spike Cir is a home located in Yellowstone County with nearby schools including Fred W. Graff School, West School, and Laurel Middle School.
Ownership History
Date
Name
Owned For
Owner Type
Purchase Details
Closed on
Aug 28, 2015
Sold by
Hatton Jay A and Hatton Amber R
Bought by
Peterson Robert J
Current Estimated Value
Home Financials for this Owner
Home Financials are based on the most recent Mortgage that was taken out on this home.
Original Mortgage
$247,959
Outstanding Balance
$194,756
Interest Rate
3.91%
Mortgage Type
New Conventional
Estimated Equity
$199,532
Purchase Details
Closed on
Feb 23, 2009
Sold by
Amish Heritage Homes Inc
Bought by
Hatton Jay A and Hatton Amber R
Home Financials for this Owner
Home Financials are based on the most recent Mortgage that was taken out on this home.
Original Mortgage
$126,000
Interest Rate
4.92%
Mortgage Type
Purchase Money Mortgage
Purchase Details
Closed on
Jul 1, 2008
Sold by
Iron Horse Station Llc
Bought by
Amish Heritage Homes Inc
Create a Home Valuation Report for This Property
The Home Valuation Report is an in-depth analysis detailing your home's value as well as a comparison with similar homes in the area
Home Values in the Area
Average Home Value in this Area
Purchase History
| Date | Buyer | Sale Price | Title Company |
|---|---|---|---|
| Peterson Robert J | -- | American Title & Escrow | |
| Hatton Jay A | -- | St | |
| Amish Heritage Homes Inc | -- | St |
Source: Public Records
Mortgage History
| Date | Status | Borrower | Loan Amount |
|---|---|---|---|
| Open | Peterson Robert J | $247,959 | |
| Previous Owner | Hatton Jay A | $126,000 |
Source: Public Records
Tax History Compared to Growth
Tax History
| Year | Tax Paid | Tax Assessment Tax Assessment Total Assessment is a certain percentage of the fair market value that is determined by local assessors to be the total taxable value of land and additions on the property. | Land | Improvement |
|---|---|---|---|---|
| 2025 | $3,227 | $402,100 | $68,801 | $333,299 |
| 2024 | $3,227 | $344,700 | $62,919 | $281,781 |
| 2023 | $2,963 | $344,700 | $62,919 | $281,781 |
| 2022 | $2,575 | $285,200 | $50,887 | $234,313 |
| 2021 | $2,597 | $285,200 | $0 | $0 |
| 2020 | $2,413 | $259,600 | $0 | $0 |
| 2019 | $2,358 | $259,600 | $0 | $0 |
| 2018 | $2,527 | $257,700 | $0 | $0 |
| 2017 | $2,348 | $257,700 | $0 | $0 |
| 2016 | $2,214 | $244,900 | $0 | $0 |
| 2015 | $2,122 | $237,300 | $0 | $0 |
| 2014 | $1,746 | $101,495 | $0 | $0 |
Source: Public Records
Map
Nearby Homes
- 1003 Montana Ave
- 109 E 12th St
- 1336 Pennsylvania Ave
- 802-816 Date Ave
- 1004 E 8th St
- 516 Pennsylvania Ave
- 810 Piper Loop
- 1006 Sunhaven Dr
- 1008 Sunhaven Dr
- 717 E 5th, 506 Alder Ave
- 1104 E 8th St
- 1108 E 8th St
- 1115 Sunhaven Dr
- 518 Date Ave
- 801 E 4th St
- 110 E 5th St
- 403 Grandview Blvd
- 512 W 14th St
- 1036 9th Ave
- 1805 E Maryland Ln
- 1002 Golden Spike Cir
- 1003 Santa fe Cir
- 1001 Sante fe Cir
- 1005 Sante fe Cir
- 1001 Golden Spike Cir
- 504 Santa fe Dr
- 1003 Golden Spike Cir
- 1003 Golden Spike Cir
- 406 Santa fe Dr
- 502 Santa fe Dr
- 1002 Santa fe Cir
- 1005 Golden Spike Dr
- 1002 Sante fe Cir
- 1007 Golden Spike Cir
- 1004 Golden Spike Dr
- 1004 Sante fe Cir
- 919 Wyoming Ave
- 1004 Santa fe Cir
- 1002 Golden Spike Dr
- 1006 Golden Spike Dr